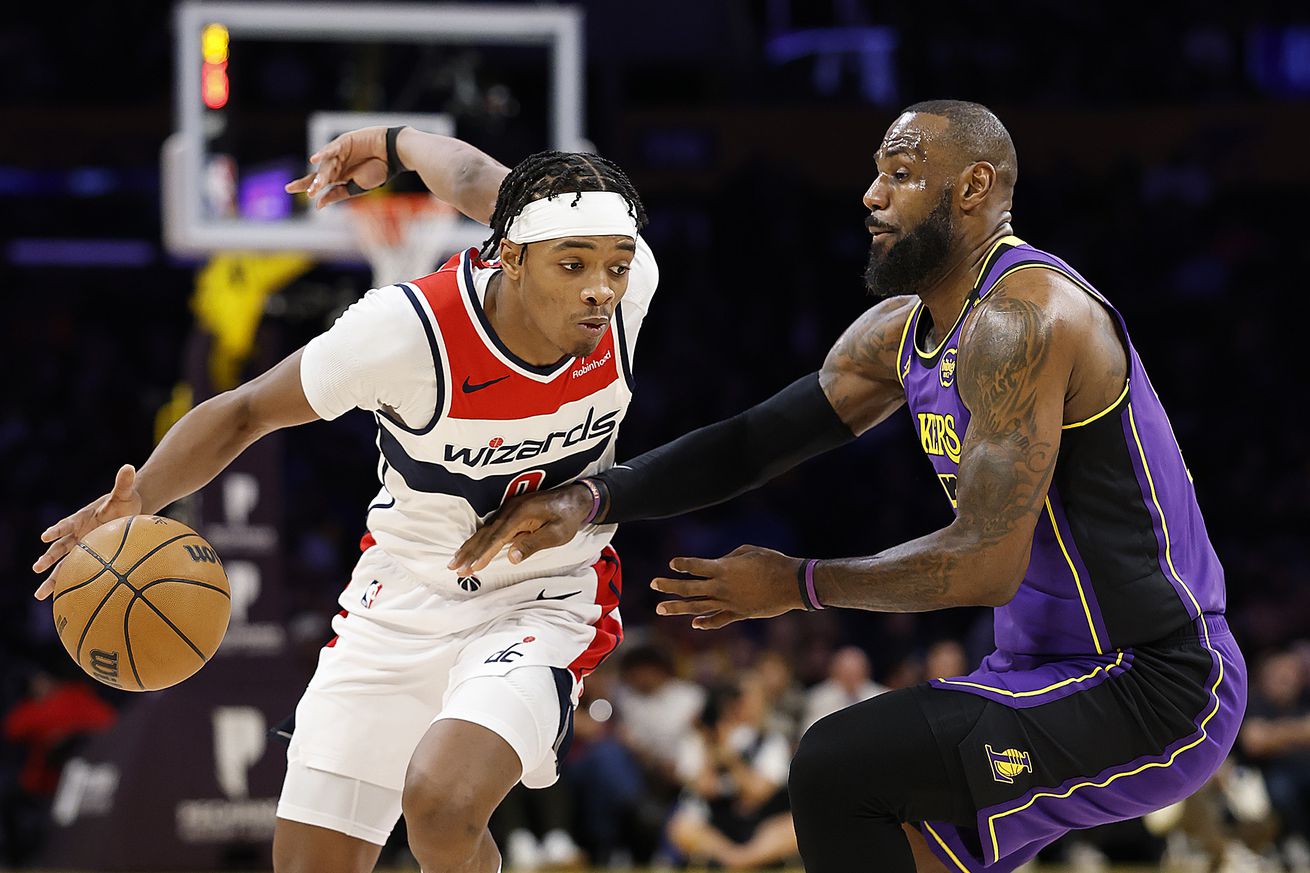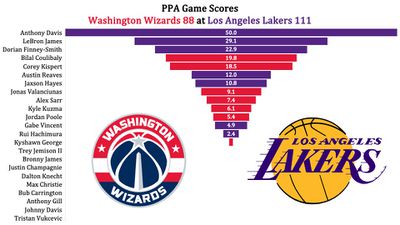
The Wizards went to Los Angeles and got thumped by Anthony Davis, LeBron James, and perhaps the LA nightlife. The final margin was 23 points, which belies that it was a 12-point game through three quarters. That 12-point margin through 75% of the game was a bit misleading, though — Washington was “competitive” primarily because the Lakers were missing loads of open and wide-open shots.
The game was controlled by the Lakers’ veteran stars, Davis and James. Davis dominated on both ends of the floor — 29 points, 16 rebounds, 5 assists, a steal, and 4 blocks. His offensive rating (points produced per possession x 100) was 129 with a 31.4% usage rate. The team defense stifled the Wizards offense when Davis was out there — they could manage an offensive rating of just 82 with Davis anchoring the middle.
For the game, the Wizards’ offensive rating was 88 — their second worst offensive performance of the season.
James was terrific, as well despite subpar efficiency. He posted his 121st triple-double — 21 points, 10 rebounds, 13 assists. The Wizards have 113 triple-doubles in its entire franchise history. James shot just 8-18 and committed 5 turnovers, so it wasn’t an all-time night for him, but he was still excellent.
Dorian Finney-Smith, who’s played poorly since the Lakers traded for him, erupted for 16 points on 6-8 shooting against Washington. It’s amazing what a steady diet of wide-open shots can do for a professional basketball player.
Bright spots for the Wizards?
- In the third quarter, Bilal Coulibaly emerged from what’s been a quiet few weeks to produce 12 points, 3 rebounds (all from the offensive glass) and an assist. In one stretch, he scored 10 straight points for the Wizards. For the game, Coulibaly totaled 17 points, 6 rebounds, 4 assists, a steal and two blocks. That’s a solid game.
- Corey Kispert shot 3-7 from three-point range.
- Jonas Valanciunas had a solid audition for a potential Wizards trade partner — 8 points on 6 shots, 7 rebounds, 2 assists. The Lakers could use him.
- Alex Sarr set a new career high with 5 blocked shots.
- Kyle Kuzma was inefficient on offense and exhibited cringey shot selection, but he contributed in non-scoring ways with 9 rebounds, 5 assists, and “only” two turnovers. Also, the defense was at it’s worst when he was out there, and the Wizards were -18 with him on the floor…still, it was good to see some positive production from him despite yet another poor shooting night.
- Fun fact: the Wizards have four players on the roster (Coulibaly, Kyshawn George, Bub Carrington, and Alex Sarr) who were born after LeBron James’ NBA debut.
Four Factors
Below are the four factors that decide wins and losses in basketball — shooting (efg), rebounding (offensive rebounds), ball handling (turnovers), fouling (free throws made).
The four factors are measured by:
- eFG% (effective field goal percentage, which accounts for the three-point shot)
- OREB% (offensive rebound percentage)
- TOV% (turnover percentage — turnovers divided by possessions)
- FTM/FGA (free throws made divided by field goal attempts)
In the table below are the four factors using the percentages and rates traditionally presented. There’s also a column showing league average in each of the categories to give a sense of each team’s performance relative to the rest of the league this season.
Stats & Metrics
Below are a few performance metrics, including the Player Production Average (PPA) Game Score. PPA is my overall production metric, which credits players for things they do that help a team win (scoring, rebounding, playmaking, defending) and dings them for things that hurt (missed shots, turnovers, bad defense, fouls).
Game Score (GmSC) converts individual production into points on the scoreboard. The scale is the same as points and reflects each player’s total contributions for the game. The lowest possible GmSC is zero.
PPA is a per possession metric designed for larger data sets. In small sample sizes, the numbers can get weird. In PPA, 100 is average, higher is better and replacement level is 45. For a single game, replacement level isn’t much use, and I reiterate the caution about small samples sometimes producing weird results.
POSS is the number of possessions each player was on the floor in this game.
ORTG = offensive rating, which is points produced per individual possessions x 100. League average last season was 114.8. Points produced is not the same as points scored. It includes the value of assists and offensive rebounds, as well as sharing credit when receiving an assist.
USG = offensive usage rate. Average is 20%.
ORTG and USG are versions of stats created by former Wizards assistant coach Dean Oliver and modified by me. ORTG is an efficiency measure that accounts for the value of shooting, offensive rebounds, assists and turnovers. USG includes shooting from the floor and free throw line, offensive rebounds, assists and turnovers.
+PTS = “Plus Points” is a measure of the points gained or lost by each player based on their efficiency in this game compared to league average efficiency on the same number of possessions. A player with an offensive rating (points produced per possession x 100) of 100 who uses 20 possessions would produce 20 points. If the league average efficiency is 114, the league — on average — would produced 22.8 points in the same 20 possessions. So, the player in this hypothetical would have a +PTS score of -2.8.

by Kevin Broom