Stats, commentary, analysis.
The Washington Wizards lost to the Portland Trail Blazers last night for two main reasons: poor rebounding and too many turnovers.
Washington outshot Portland by a significant margin (eFG% 59.0% to 50.5%), which is usually the key ingredient in an NBA victory. But the Trail Blazers grabbed 17 offensive rebounds, and the Wizards committed 19 turnovers, which led to Portland hoisting 18 shots more than Washington.
The Trail Blazers held a 21-6 advantage in second chance points, and a 27-18 edge in points off turnovers. Despite playing without a center most of the game (Donovan Clingan started and played just 18 minutes), Portland dominated inside — 62-42 on points in the paint — and in transition (32-16 in fastbreak points).
Washington stayed as close as they did because Portland struggled with their shooting much of the night.
After a first half rock fight (both teams had offensive ratings (points per possession x 100) below 100 in the first half), the contest had genuinely good moments. The highlight was a spectacular dunk by Shaedon Sharpe, which NBA.com’s Dunk Score rates as the second best in the NBA this season.
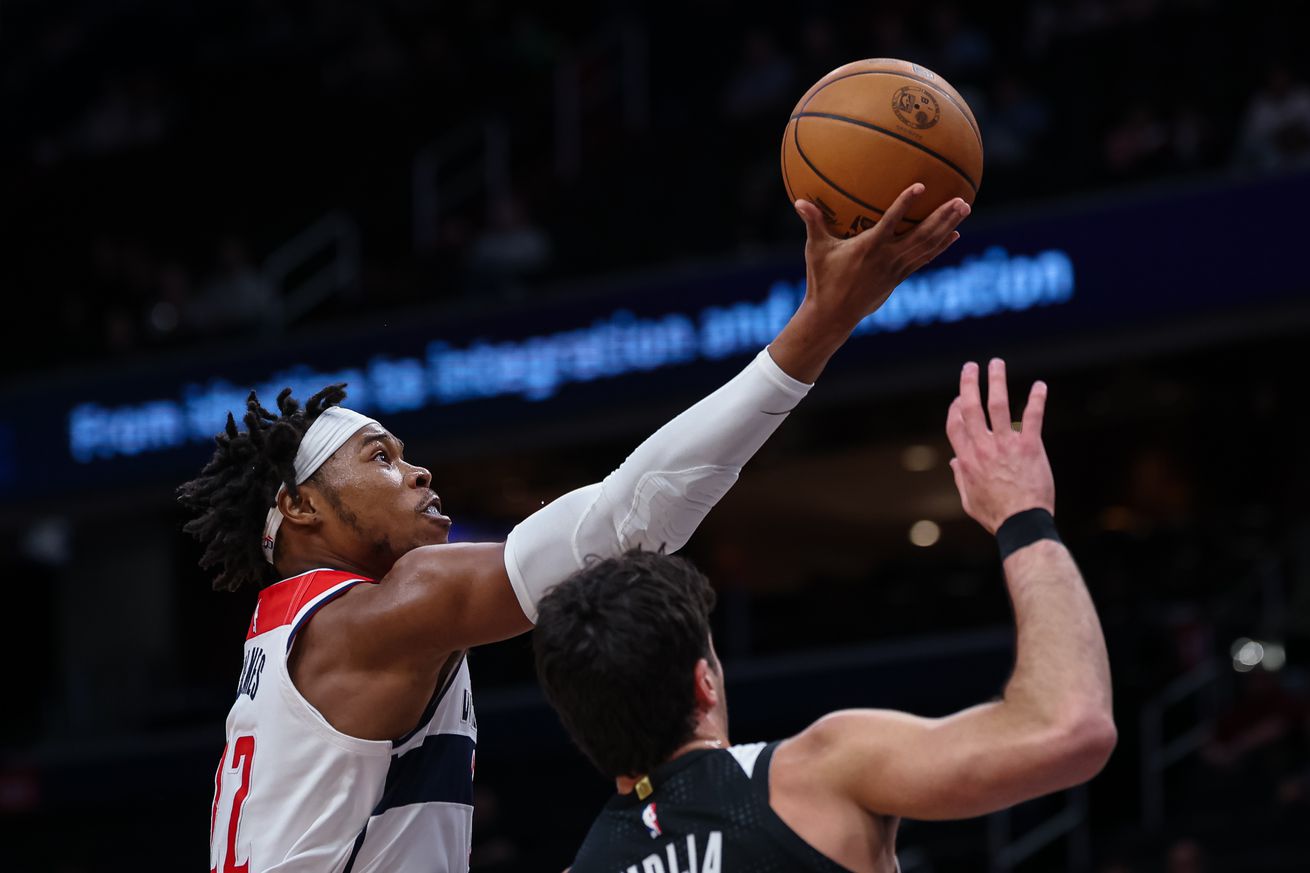
One disappointment: the return of Deni Avdija was cut short by a quad contusion. Avdija lasted just six minutes before having to sit for the game. After a slow start to the season, Avdija hit a hot streak for a couple weeks before his production fell off. He received a nice reception from the DC fans, and it would have been good to see him put on a show for supporters of his first NBA home.
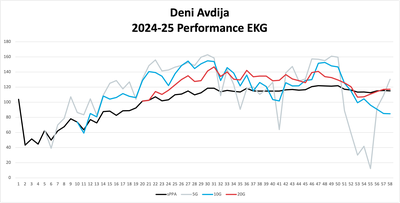
Here’s a look at his PPA performance EKG so far this season (not including last night’s game). PPA is my overall performance metric, which accounts for defensive impact and role. In PPA, 100 is average, higher is better, and replacement level is 45. In the image below:
- Black line is his full season PPA after each game.
- Grey line is his five-game rolling average PPA.
- Blue line is his 10-game rolling average PPA.
- Red line is his 20-game rolling average PPA.
Kevin Broom
Bright Spots for the Wizards
- Richaun Holmes shot 7-7 from the floor and 6-6 from the free throw line. The Wizards defense was excellent when he was out there, and the team was +12 in his 19 minutes of action.
- Jordan Poole had an efficient and effective game — 24 points, 5 rebounds, 3 assists, a steal and a block. His offensive rating was 121 on 27.4% usage, which is very good.
- Bub Carrington, the 19-year-old guard, led the Wizards with eight rebounds in 26 minutes.
- Corey Kispert shot 5-6 from three-point range.
Just Spots
- Bilal Coulibaly shot 7-9 from the field and still ended up with a well-below-average 107 offensive rating (league average is 113.9 this season). He did it by going 2-6 from the free throw line and committing three turnovers. Bright side, his individual defense was good, though the team defense was rancid when he was out there.
- Justin Champagnie helped on the boards (5 rebounds in 12 minutes) but committed three turnovers.
- Kyshawn George played hard but hurt the team with 4 turnovers and 5 fouls in 27 minutes.
- Tristan Vukcevic had a rough outing — 3-7 from the floor, just 2 rebounds in 19 minutes, plus 2 turnovers.
- Last night’s pace of play (110 possessions) was Washington’s second fastest paced game of the season. Top mark was 112 possessions Nov. 15 against the Atlanta Hawks.
Four Factors
Below are the four factors that decide wins and losses in basketball — shooting (efg), rebounding (offensive rebounds), ball handling (turnovers), fouling (free throws made).
The four factors are measured by:
- eFG% (effective field goal percentage, which accounts for the three-point shot)
- OREB% (offensive rebound percentage)
- TOV% (turnover percentage — turnovers divided by possessions)
- FTM/FGA (free throws made divided by field goal attempts)
In the table below are the four factors using the percentages and rates traditionally presented. There’s also a column showing league average in each of the categories to give a sense of each team’s performance relative to the rest of the league this season.
Stats & Metrics
Below are a few performance metrics. PPA is my overall production metric, which credits players for things they do that help a team win (scoring, rebounding, playmaking, defending) and dings them for things that hurt (missed shots, turnovers, bad defense, fouls).
PPA is a per possession metric designed for larger data sets. In small sample sizes, the numbers can get weird. In PPA, 100 is average, higher is better and replacement level is 45. For a single game, replacement level isn’t much use, and I reiterate the caution about small samples sometimes producing weird results.
POSS is the number of possessions each player was on the floor in this game.
ORTG = offensive rating, which is points produced per individual possessions x 100. League average last season was 114.8. Points produced is not the same as points scored. It includes the value of assists and offensive rebounds, as well as sharing credit when receiving an assist.
USG = offensive usage rate. Average is 20%.
ORTG and USG are versions of stats created by former Wizards assistant coach Dean Oliver and modified by me. ORTG is an efficiency measure that accounts for the value of shooting, offensive rebounds, assists and turnovers. USG includes shooting from the floor and free throw line, offensive rebounds, assists and turnovers.
+PTS = “Plus Points” is a measure of the points gained or lost by each player based on their efficiency in this game compared to league average efficiency on the same number of possessions. A player with an offensive rating (points produced per possession x 100) of 100 who uses 20 possessions would produce 20 points. If the league average efficiency is 114, the league — on average — would produced 22.8 points in the same 20 possessions. So, the player in this hypothetical would have a +PTS score of -2.8.
Players are sorted by total production in the game.