The Washington Wizards were close to beating Poole’s former team. But close isn’t good enough.
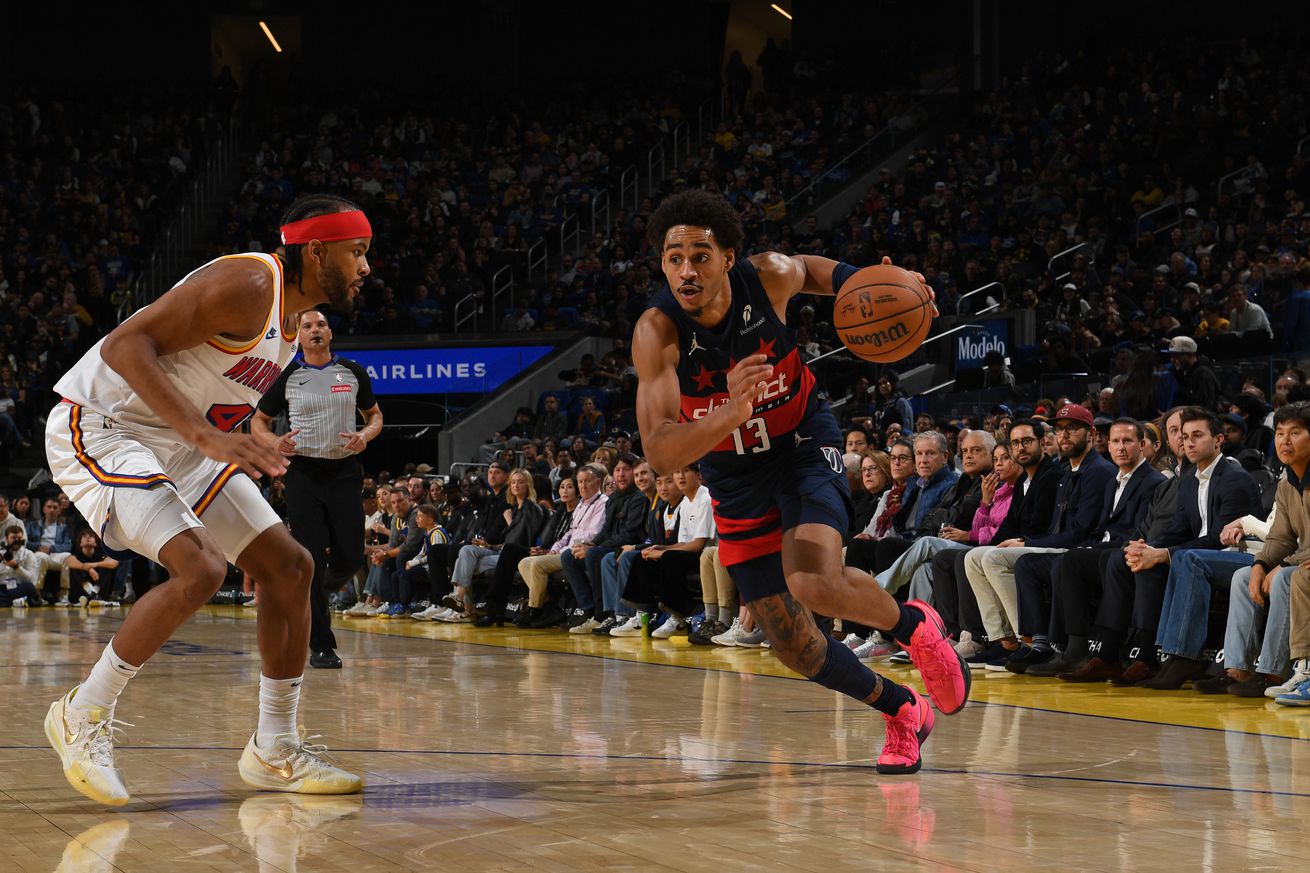
As revenge games go, this one was pretty good. Former Golden State Warriors guard Jordan Poole erupted for 38 points, 5 rebounds, and 5 assists against his former team. The only mar on the night: the Wizards couldn’t secure the win despite setting a franchise record for most made threes in a game with 22.
Well, there were other mars on the night, namely Warriors star Stephen Curry exiting the game after he turned his ankle blocking a Poole fastbreak layup shot attempt in the final minutes of the game, and Warriors star Draymond Green missing all but three minutes with an injury of his own.
Still, on a night dominated by the Washington Commanders 45-31 victory over the Detroit Lions in the NFL playoffs, the Wizards and Warriors played an entertaining, engaging, and competitive game. In this game, the Wizards led by 10 in the second and third quarters. The Warriors led by 10 twice in the fourth. There were 12 ties and 14 lead changes.
Bright spots?
- If someone told me that in a Warriors game, a player shot 8-15 from three-point range, I would not have guessed that player was Jordan Poole. He was excellent against his former team — 38 points on 25 shots, 5 assists to 2 turnovers, and repeated blow-bys while being defended by Gary Payton II. Poole’s offensive rating (points produced per possession x 100): 137 on 34.4% usage.
- Perhaps the most important stat of the night: 52%. That was the share of court time for Wizards players 21 and under.
- The Wizards set a new franchise record with 22 made threes. The previous high was 21, which they did twice — Feb. 14, 2024 in a loss to the New Orleans Pelicans, and Oct. 28, 2024 in a win against the Atlanta Hawks.
- With a 118 offensive rating, the Wizards were good enough on the offensive end to win. The problem? They allowed the Warriors to grab offensive rebounds (oreb% of 34.0%) and could force just 9 turnovers offensive rebounding rate of 34.0%) and “forced” (I use the term loosely) just 9 turnovers.
- Kyle Kuzma played a stronger game than he’s had much of the season — 22 points on 12 shots, 3-6 from three, plus 6 rebounds and 4 assists. The turnovers are still an issue (he had three more last night), and the team was -17 in his minutes (team worst). Still, if they hope to trade him, the Wizards need more games like this from him before the Feb. 6 trade deadline.
- Bub Carrington was quietly productive — 17 points on 8 shots, 4-6 on threes, 3 assists and a steal. He also had a pair of turnovers and 4 fouls.
- Alex Sarr was pretty good — 11 points, 9 rebounds, 2 assists, a steal and a block. The team defense was best (not the same as good) when he was on the floor.
Just spots?
- While the Wizards were indeed good enough on offense to win, it’s a little disconcerting for the team to post an ortg of just 118 on a night they set a record with 22 made threes. That’s because their hot shooting from deep didn’t translate to two-point attempts. On twos, they shot 16-41 — 39.0%.
- Kyshawn George gave a good effort but was generally unproductive in his 30 minutes of action.
- Rough night for Bilal Coulibaly, who hit just 2-8 from the floor, missed all four of his three-point attempts, and committed four turnovers. The six rebounds and seven assists were nice. He had a few good defensive possessions, though his overall defensive impact was muted.
- One puzzling thing: head coach Brian Keefe used just eight players against Golden State — the first night of a back-to-back. That meant zero minutes for Jared Butler (who’s been playing excellent basketball the past few weeks), and Justin Champagnie (who’s among the team’s most productive players on a per possession basis).
Four Factors
Below are the four factors that decide wins and losses in basketball — shooting (efg), rebounding (offensive rebounds), ball handling (turnovers), fouling (free throws made).
The four factors are measured by:
- eFG% (effective field goal percentage, which accounts for the three-point shot)
- OREB% (offensive rebound percentage)
- TOV% (turnover percentage — turnovers divided by possessions)
- FTM/FGA (free throws made divided by field goal attempts)
In the table below, I’ve provided the four factors using the percentages and rates traditionally presented. I’ve also added a column showing league average in each of the categories to give a sense of each team’s performance relative to the rest of the league this season.
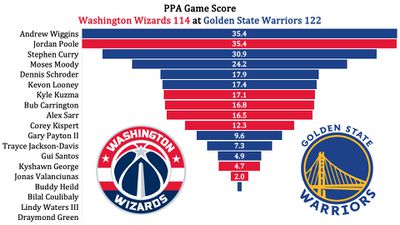
Stats & Metrics
Below are a few performance metrics, including the Player Production Average (PPA) Game Score. PPA is my overall production metric, which credits players for things they do that help a team win (scoring, rebounding, playmaking, defending) and dings them for things that hurt (missed shots, turnovers, bad defense, fouls).
Game Score (GmSC) converts individual production into points on the scoreboard. The scale is the same as points and reflects each player’s total contributions for the game. The lowest possible GmSC is zero.
PPA is a per possession metric designed for larger data sets. In small sample sizes, the numbers can get weird. In PPA, 100 is average, higher is better and replacement level is 45. For a single game, replacement level isn’t much use, and I reiterate the caution about small samples sometimes producing weird results.
POSS is the number of possessions each player was on the floor in this game.
ORTG = offensive rating, which is points produced per individual possessions x 100. League average last season was 114.8. Points produced is not the same as points scored. It includes the value of assists and offensive rebounds, as well as sharing credit when receiving an assist.
USG = offensive usage rate. Average is 20%.
ORTG and USG are versions of stats created by former Wizards assistant coach Dean Oliver and modified by me. ORTG is an efficiency measure that accounts for the value of shooting, offensive rebounds, assists and turnovers. USG includes shooting from the floor and free throw line, offensive rebounds, assists and turnovers.
+PTS = “Plus Points” is a measure of the points gained or lost by each player based on their efficiency in this game compared to league average efficiency on the same number of possessions. A player with an offensive rating (points produced per possession x 100) of 100 who uses 20 possessions would produce 20 points. If the league average efficiency is 114, the league — on average — would produced 22.8 points in the same 20 possessions. So, the player in this hypothetical would have a +PTS score of -2.8.
by Kevin Broom