Plus The Numbers Crunch: Stats, analysis, commentary
Same city, different opponent, different arena, similar result — this time, the Washington Wizards lost to the Los Angeles Clippers, 110-93. It was Washington’s 12th consecutive loss. Their Western Conference road trip continues Saturday night against the Phoenix Suns and old friend Bradley Beal.
This one was a desultory affair. The Wizards never led, though they did battle the Clippers to a 4-4 tie through the first 2:36 of the game. The contest got out of hand quick. Los Angeles led 44-22 at one point, held a 25-point lead in the first half, and a 27-point lead in the second.
Then the Clippers seemed to get bored and went into a tailspin of turnovers, and Washington was able to get the lead down to 12. The actual outcome was never in serious doubt, and the Clippers coasted home with a 17-point win.
With the Clippers kicking the ball all over the court (18 turnovers) and posting an offensive rating (points per possession x 100) of just 108, competent offense from Washington could have made things interesting. Outside of Jordan Poole and Jonas Valanciunas, offensive competence was in short supply for the Wizards. They shot 23.9% from three-point range, and posted a 39.9% eFG% — their second worst shooting performance of the season.
Brutal.
Bright spots for the Wizards?
- Jordan Poole had a rough shooting night from the floor — 42.1% eFG% (6-19 from the floor, and 4-12 from three), but he got to the free throw line frequently and hit them all — 8-8. He also produced 9 assists to 1 turnover and came up with a pair of steals. He was productive even while missing shots.
- Valanciunas scored 12 points on 7 shots and grabbed 10 rebounds in just 18 minutes.
- Alex Sarr didn’t shoot well but grabbed 10 rebounds — the sixth time this season he’s hit double digits on the boards.
Other stuff?
- Clippers guard James Harden, who’s having one of the worst seasons of his career (which is not to say he’s bad — just not anywhere close to his previous very high standards), posted a triple-double on the Wizards — 17 points, 12 rebounds, 13 assists. He was four turnovers from a quadruple-double.
- Derrick Jones Jr. hit his first 6 shots and finished with 19 points on 10 shots, as well as 8 rebounds and a couple steals.
- Mo Bamba hit three threes on the Wizards.
- Norman Powell, who’s having the best season of his career, scored 22 points and had 3 steals.
- Kyle Kuzma played an awful game. Early in the game, he sought to be a playmaker. That didn’t go well, and it didn’t last. For the game, he shot just 3-12 from the floor, grabbed 7 rebounds, and had 3 assists and 2 turnovers. Several of his missed shots elicited laughs from the watch group on Playback. His offensive rating was 62 on a 20.0% usage rate. The Wizards were -25 in his 28 minutes.
Four Factors
Below are the four factors that decide wins and losses in basketball — shooting (efg), rebounding (offensive rebounds), ball handling (turnovers), fouling (free throws made).
The four factors are measured by:
- eFG% (effective field goal percentage, which accounts for the three-point shot)
- OREB% (offensive rebound percentage)
- TOV% (turnover percentage — turnovers divided by possessions)
- FTM/FGA (free throws made divided by field goal attempts)
In the table below are the four factors using the percentages and rates traditionally presented. There’s also a column showing league average in each of the categories to give a sense of each team’s performance relative to the rest of the league this season.
Stats & Metrics
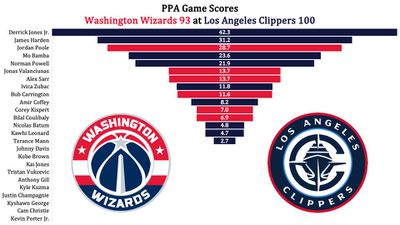
Below are a few performance metrics, including the Player Production Average (PPA) Game Score. PPA is my overall production metric, which credits players for things they do that help a team win (scoring, rebounding, playmaking, defending) and dings them for things that hurt (missed shots, turnovers, bad defense, fouls).
Game Score (GmSC) converts individual production into points on the scoreboard. The scale is the same as points and reflects each player’s total contributions for the game. The lowest possible GmSC is zero.
PPA is a per possession metric designed for larger data sets. In small sample sizes, the numbers can get weird. In PPA, 100 is average, higher is better and replacement level is 45. For a single game, replacement level isn’t much use, and I reiterate the caution about small samples sometimes producing weird results.
POSS is the number of possessions each player was on the floor in this game.
ORTG = offensive rating, which is points produced per individual possessions x 100. League average last season was 114.8. Points produced is not the same as points scored. It includes the value of assists and offensive rebounds, as well as sharing credit when receiving an assist.
USG = offensive usage rate. Average is 20%.
ORTG and USG are versions of stats created by former Wizards assistant coach Dean Oliver and modified by me. ORTG is an efficiency measure that accounts for the value of shooting, offensive rebounds, assists and turnovers. USG includes shooting from the floor and free throw line, offensive rebounds, assists and turnovers.
+PTS = “Plus Points” is a measure of the points gained or lost by each player based on their efficiency in this game compared to league average efficiency on the same number of possessions. A player with an offensive rating (points produced per possession x 100) of 100 who uses 20 possessions would produce 20 points. If the league average efficiency is 114, the league — on average — would produced 22.8 points in the same 20 possessions. So, the player in this hypothetical would have a +PTS score of -2.8.

by Kevin Broom
