Stats, commentary, analysis
A third quarter defensive collapse was too much for the Wizards to overcome in the final period, and they lost to the Atlanta Hawks, 125-111.
Washington entered the third period trailing by five after a competitive see-saw first half against Atlanta. The Wizards led by as much as seven in the first half — the Hawks by as much as five. Things got out of hand fast in the late second and third periods. With 1:18 to play in the second, the game was tied. When the halftime buzzer sounded, the Wizards were down five. Just 13 minutes and 3 seconds later, Atlanta was up 23.
The Wizards made things kinda interesting, slicing the margin to as little as seven before running out of gas and taking the 14-point loss.
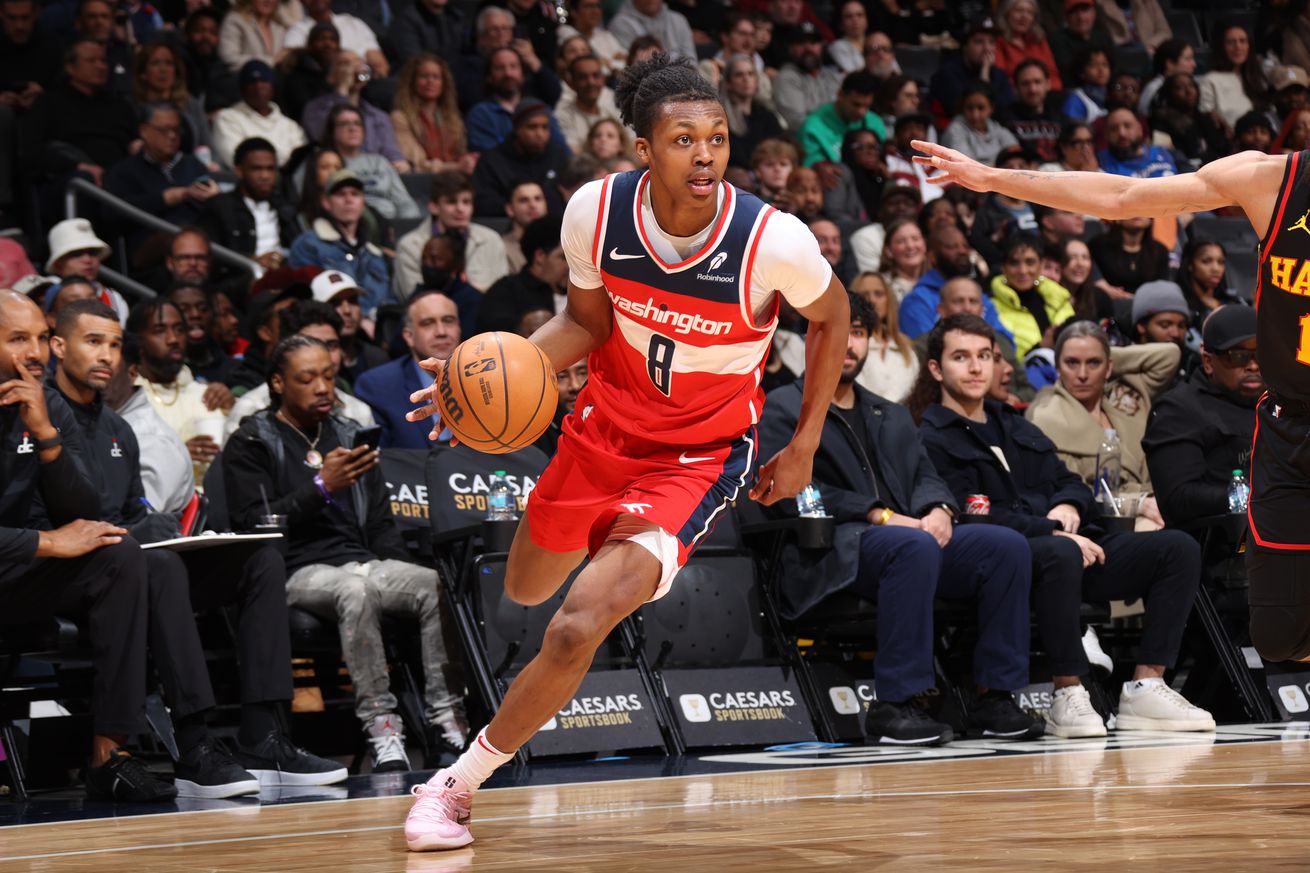
For Washington, the story of the game was 19-year-old rookie Bub Carrington going for a career high 23 points on just 13 field goal attempts. It was a hyper-efficient game for Carrington — a 160 offensive rating (points produced per possession x 100) on 16.4% usage.
Carrington became just the fifth teenager in franchise history to score more than 20 in a game. The others?
- Bradley Beal, 2012-13 — 13 times
- Bilal Coulibaly, 2023-24 — 2
- Alex Sarr, 2024-25 — 2
- Troy Brown Jr., 2018-19 — 1
As an aside, here’s the top 10 all-time for teenagers scoring 20+ points in a game:
- LeBron James — 62 (two seasons as a teen)
- Carmelo Anthony — 49
- Kevin Durant — 44
- Anthony Edwards — 36
- Luka Doncic — 33
- Kobe Bryant — 24 (two seasons as a teen)
- Kyrie Irving — 22
- Andrew Wiggins — 17
- Devin Booker — 17
- LaMelo Ball — 17
The list of guys who did it just once is not quite as impressive, though it does include Giannis Antetokounmpo and Karl-Anthony Towns. The teens who notched 20+ twice include Jermaine O’Neal, Lamar Odom, Tony Parker, Zach LaVine, Brandon Ingram, and Alperen Sengun.
Bright Spots for the Wizards?
- Tristan Vukcevic had a good game — 8 points and 8 rebounds in just 14 minutes. While his defensive presence needs work, and he needs to get stronger, the team defense was at its best tonight when he was on the floor.
- Richaun Holmes was decent again. This recent stretch of action is likely enough to earn him a contract somewhere in the NBA next season.
- Despite losing contact with the Hawks and falling behind by more than 20, the Wizards stayed in the game and kept battling.
- AJ Johnson got 7 minutes and had a few nice passes. Jaylen Martin, who took Jared Butler’s two-way contract slot and uniform number, saw his first action in a Wizards uniform.
- Justin Champagnie had 10 points and 8 rebounds in 25 minutes. He also committed four turnovers — an astronomical 34.7% turnover rate.
- Bilal Coulibaly led the team with 20 field goal attempts. He made just 6, which isn’t good, but he stayed aggressive from start to finish.
Just Spots
- Jordan Poole played a sloppy game — 8-17 from the floor, 1-8 from deep, 5 turnovers and 5 fouls. He had a lot of problems getting things done against Dyson Daniels’ excellent defense.
- Malcolm Brogdon was 0-6 from the floor. His 19 PPA (which is terrible) was kinda impressive given the atrocious shooting. He made up for it (somewhat) by hitting 7-7 from the free throw line, and having 3 rebounds, 4 assists and a steal vs. 2 turnovers. Not good, but he at least contributed something.
- This was almost a perfectly average game for Washington. Their offensive rating entering the game: 106.1. Against the Hawks: 106.1. Their defensive rating for the season: 119.6. Against Atlanta: 119.4.
- The Wizards shot 9-36, 25.0% from three-point range. By percentage, that’s tied for their 12th worst three-point shooting performance of the season. Considering that they shot 7-28 the last time they shot exactly 25.0% from deep, this one gets sole possession of the 12th spot in my eyes.
Four Factors
Below are the four factors that decide wins and losses in basketball — shooting (efg), rebounding (offensive rebounds), ball handling (turnovers), fouling (free throws made).
The four factors are measured by:
- eFG% (effective field goal percentage, which accounts for the three-point shot)
- OREB% (offensive rebound percentage)
- TOV% (turnover percentage — turnovers divided by possessions)
- FTM/FGA (free throws made divided by field goal attempts)
In the table below are the four factors using the percentages and rates traditionally presented. There’s also a column showing league average in each of the categories to give a sense of each team’s performance relative to the rest of the league this season.
Stats & Metrics
Below are a few performance metrics. PPA is my overall production metric, which credits players for things they do that help a team win (scoring, rebounding, playmaking, defending) and dings them for things that hurt (missed shots, turnovers, bad defense, fouls).
PPA is a per possession metric designed for larger data sets. In small sample sizes, the numbers can get weird. In PPA, 100 is average, higher is better and replacement level is 45. For a single game, replacement level isn’t much use, and I reiterate the caution about small samples sometimes producing weird results.
POSS is the number of possessions each player was on the floor in this game.
ORTG = offensive rating, which is points produced per individual possessions x 100. League average last season was 114.8. Points produced is not the same as points scored. It includes the value of assists and offensive rebounds, as well as sharing credit when receiving an assist.
USG = offensive usage rate. Average is 20%.
ORTG and USG are versions of stats created by former Wizards assistant coach Dean Oliver and modified by me. ORTG is an efficiency measure that accounts for the value of shooting, offensive rebounds, assists and turnovers. USG includes shooting from the floor and free throw line, offensive rebounds, assists and turnovers.
+PTS = “Plus Points” is a measure of the points gained or lost by each player based on their efficiency in this game compared to league average efficiency on the same number of possessions. A player with an offensive rating (points produced per possession x 100) of 100 who uses 20 possessions would produce 20 points. If the league average efficiency is 114, the league — on average — would produced 22.8 points in the same 20 possessions. So, the player in this hypothetical would have a +PTS score of -2.8.
Note: I’ve hit the eject button on PPA Game Scores for now. I haven’t liked much how it’s been working this season, so I’ve decided to stop publishing it until I have time to retool.