Recap, stats, commentary, analysis
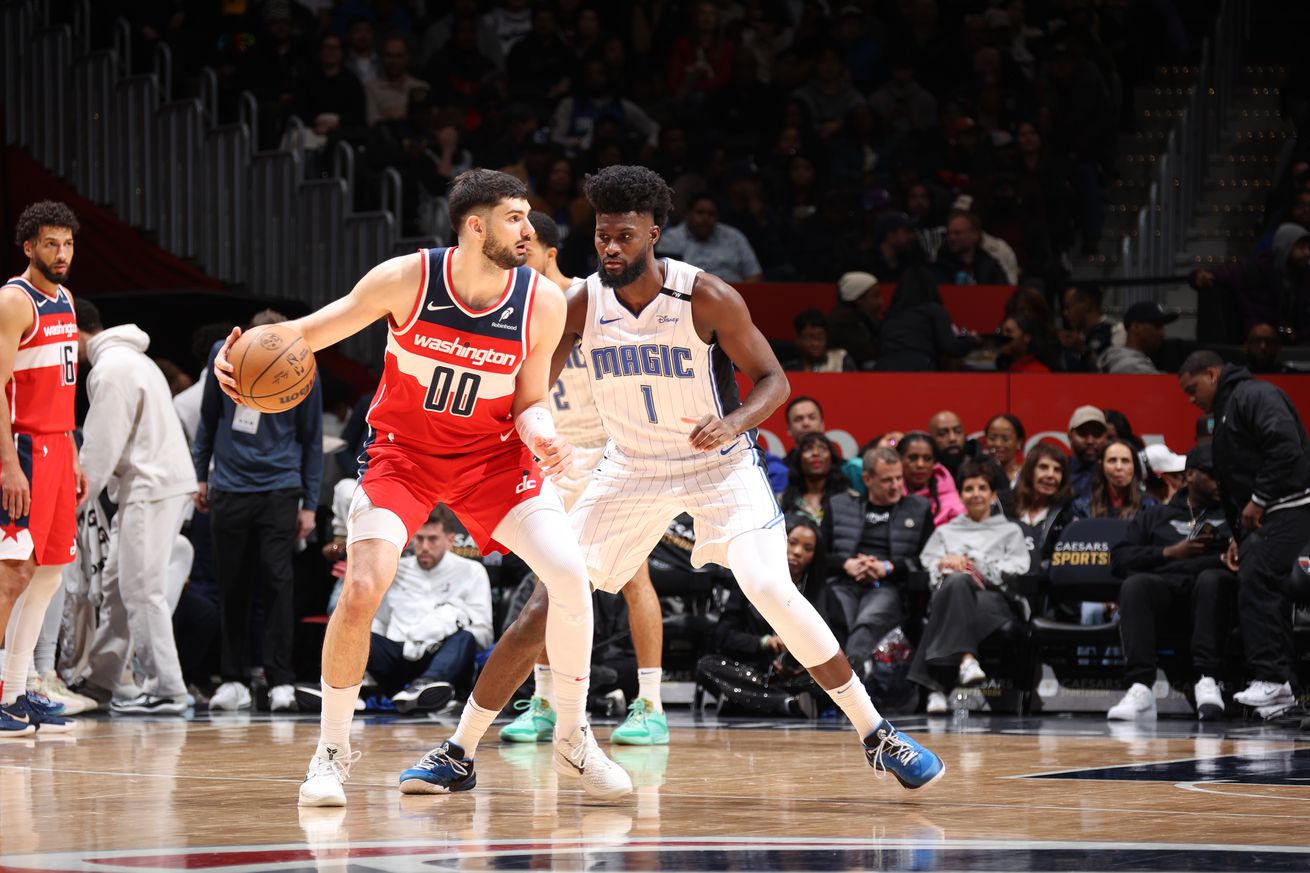
The Washington Wizards returned home from a seven-game road trip to get blasted by the Orlando Magic and become the first Eastern Conference team to get officially eliminated from the playoffs. The Utah Jazz and New Orleans Pelicans were previously excluded in the more competitive West. The final score of this one — Orlando: 120, Washington: 105.
If you simply saw the score of this one, you might think it was reasonably competitive. You’d be mostly wrong. Washington stayed in contact for the first 16-18 minutes, but they were still trailing by four despite an effective field goal percentage above 70% in the second quarter. When Orlando’s defense picked up and the shots stopped falling, Washington fell behind quick and stayed there.
The deficit ballooned to 33 early in the fourth quarter, at which point the slacking off and garbage time crews trimmed things back to a more respectable 15 by the final buzzer.
Bright Spots for the Wizards?
- Tristan Vukcevic put up good numbers — 17 points, 6 rebounds, 3 assists, 3 steals and a block in 21 minutes. He had zero turnovers. This was probably his best game with the Wizards.
- Anthony Gill had 10 points and 5 rebounds in 22 minutes. He got to the free throw line seven times.
- Jordan Poole shot well — 7-13 from the floor and 4-8 from deep. He had some trouble getting much going against the stellar defense of Kentavious Caldwell-Pope but got loose when defended by Anthony Black or Cory Joseph or Caleb Houstan.
- AJ Johnson had some classic “youth and inexperience” blunders, but he also had some impressive moments where his athleticism popped. He finished with 14 points on 9 shots.
- Alex Sarr was okay — 19 points, 3-6 from three-point range, 10 rebounds, 2 assists in 28 minutes. The mar: 3 turnovers, which dragged down his overall efficiency.
- Kyshawn George had 8 assists, which tied his career high (set March 1 against the Charlotte Hornets).
- With the loss, Washington maintains its hold on the NBA’s worst record.
Four Factors
Below are the four factors that decide wins and losses in basketball — shooting (efg), rebounding (offensive rebounds), ball handling (turnovers), fouling (free throws made).
The four factors are measured by:
- eFG% (effective field goal percentage, which accounts for the three-point shot)
- OREB% (offensive rebound percentage)
- TOV% (turnover percentage — turnovers divided by possessions)
- FTM/FGA (free throws made divided by field goal attempts)
In the table below are the four factors using the percentages and rates traditionally presented. There’s also a column showing league average in each of the categories to give a sense of each team’s performance relative to the rest of the league this season.
Stats & Metrics
Below are a few performance metrics. PPA is my overall production metric, which credits players for things they do that help a team win (scoring, rebounding, playmaking, defending) and dings them for things that hurt (missed shots, turnovers, bad defense, fouls).
PPA is a per possession metric designed for larger data sets. In small sample sizes, the numbers can get weird. In PPA, 100 is average, higher is better and replacement level is 45. For a single game, replacement level isn’t much use, and I reiterate the caution about small samples sometimes producing weird results.
POSS is the number of possessions each player was on the floor in this game.
ORTG = offensive rating, which is points produced per individual possessions x 100. League average last season was 114.8. Points produced is not the same as points scored. It includes the value of assists and offensive rebounds, as well as sharing credit when receiving an assist.
USG = offensive usage rate. Average is 20%.
ORTG and USG are versions of stats created by former Wizards assistant coach Dean Oliver and modified by me. ORTG is an efficiency measure that accounts for the value of shooting, offensive rebounds, assists and turnovers. USG includes shooting from the floor and free throw line, offensive rebounds, assists and turnovers.
+PTS = “Plus Points” is a measure of the points gained or lost by each player based on their efficiency in this game compared to league average efficiency on the same number of possessions. A player with an offensive rating (points produced per possession x 100) of 100 who uses 20 possessions would produce 20 points. If the league average efficiency is 114, the league — on average — would produced 22.8 points in the same 20 possessions. So, the player in this hypothetical would have a +PTS score of -2.8.
Players are sorted by total production in the game.