Recap, stats, analysis, commentary.
In a game that was competitive, sloppy, and wildly entertaining, the Washington Wizards squeaked past the Charlotte Hornets, 113-110, for their fifth win of the season.
The victory will pull Washington out of the NBA basement, at least temporarily. The Wizards’ record rises to 5-23. With their loss to the Houston Rockets, the New Orleans Pelicans fell to 5-26.
Washington emerged victorious despite getting outshot and outrebounded by Charlotte. They did it by avoiding turnovers (the Hornets had 18 to Washington’s 11) and getting to the free throw line (21-11 advantage).
The Wizards got positive contributions from all sectors of the roster — starters and bench, young, old and in-between. Charlotte got little from its bench and saw disastrous stints from a few.
Bright spots for the Wizards?
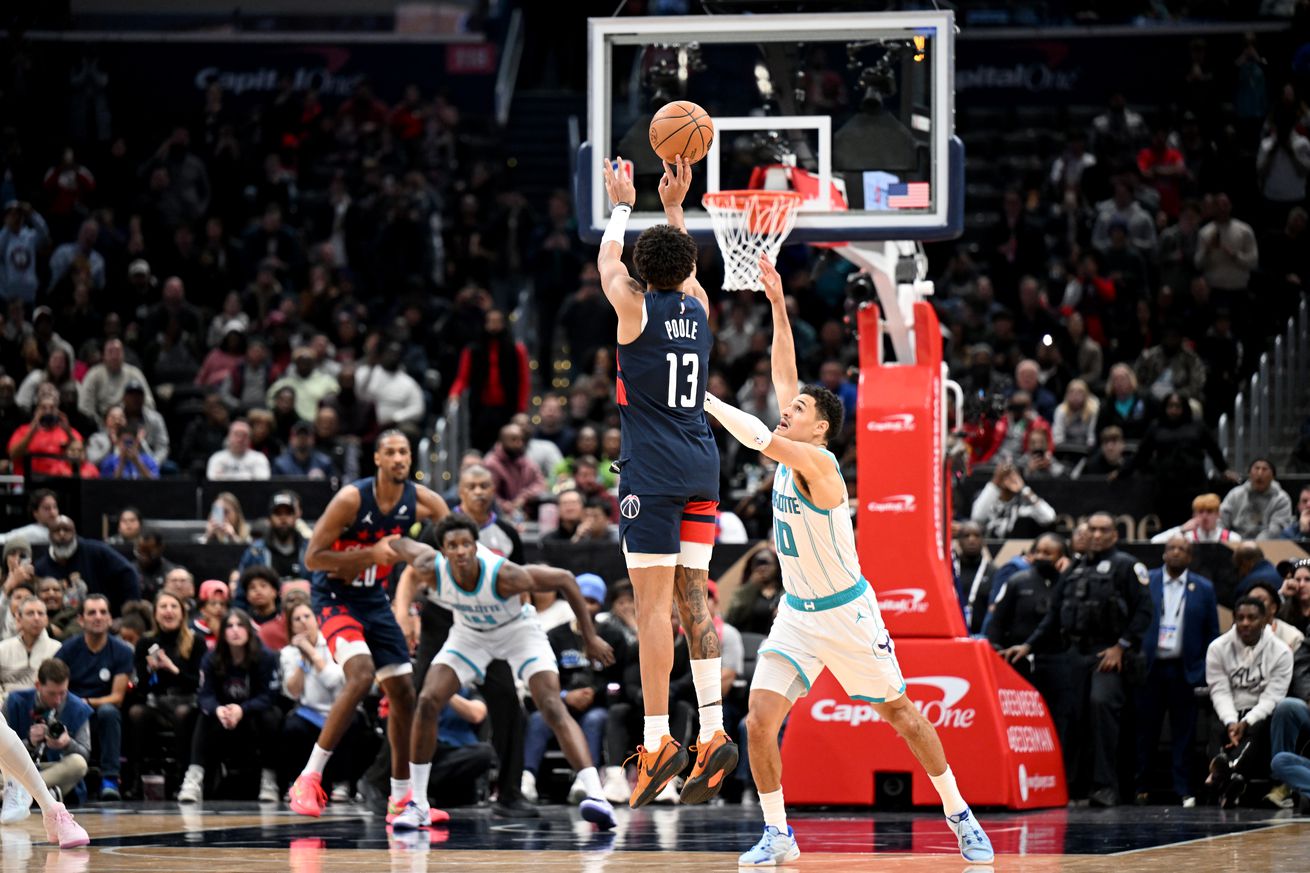
- Jordan Poole hit a massive stepback three late to put the Wizards in position to win. Kudos to Poole for gutting through the second half after taking a hard knee to the hip at the end of the first half. He finished with 25 points, 6 rebounds, 3 assists, a steal and 2 blocks. His shooting wasn’t great (eFG% of just 50.0%), but his overall offensive efficiency was strong: 117 offensive rating (average is 113.1) on 26.6% usage.
- Jonas Valanciunas was too much off the bench for the Hornets big men to handle. He finished with 14 points on 8 shots, as well as 12 rebounds, 3 assists, and 3 steals.
- Alex Sarr hit threes (3-6), contributed three blocks, and had a critical tip-in in the final seconds to secure the win.
- Bilal Coulibaly struggled with his shooting all night. In the second half, Charlotte put a center on him and dared him to shoot. While he turned down some wide open looks, he didn’t get passive — he attacked the paint and tried to create something. The results: 20 points on 6-16 shooting, 8 trips to the free throw line, 6 rebounds, 5 assists and just 1 turnover. He also defended well without fouling. A solid game with good process.
- Justin Champagnie (the team leader in my PPA metric for the season when I ran an update before last night’s game) scored 8 points on 4 shots, grabbed 6 rebounds, and had a steal and two blocks in 13 minutes.
- Bub Carrington overcame a disastrous first half (10 minutes and zeroes in every category, except for 3 fouls) to make a few positive plays in the second half. This was not a good game for him, but that competitiveness the Wizards like so much about him was evident.
Wizards head coach Brian Keefe had the Wizards back down to essentially an eight-man rotation. Champagnie started each half but played just 13 minutes. The core rotation was comprised of the oldsters, Valanciunas and Malcolm Brogdon, the middle-aged (by NBA standards) Poole and Corey Kispert, and the youngsters: Coulibaly, Sarr, Carrington, and Kyshawn George. Nearly 45% of the team’s minutes went to those youngsters — each of them 20-years old or younger.
Four Factors
Below are the four factors that decide wins and losses in basketball — shooting (efg), rebounding (offensive rebounds), ball handling (turnovers), fouling (free throws made).
Stats & Metrics
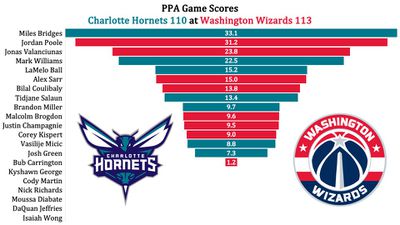
Below are a few performance metrics, including the Player Production Average (PPA) Game Score. PPA is my overall production metric, which credits players for things they do that help a team win (scoring, rebounding, playmaking, defending) and dings them for things that hurt (missed shots, turnovers, bad defense, fouls).
Game Score (GmSC) converts individual production into points on the scoreboard. The scale is the same as points and reflects each player’s total contributions for the game. The lowest possible GmSC is zero.
PPA is a per possession metric designed for larger data sets. In small sample sizes, the numbers can get weird. In PPA, 100 is average, higher is better and replacement level is 45. For a single game, replacement level isn’t much use, and I reiterate the caution about small samples sometimes producing weird results.
POSS is the number of possessions each player was on the floor in this game.
ORTG = offensive rating, which is points produced per individual possessions x 100. League average last season was 114.8. Points produced is not the same as points scored. It includes the value of assists and offensive rebounds, as well as sharing credit when receiving an assist.
USG = offensive usage rate. Average is 20%.
ORTG and USG are versions of stats created by former Wizards assistant coach Dean Oliver and modified by me. ORTG is an efficiency measure that accounts for the value of shooting, offensive rebounds, assists and turnovers. USG includes shooting from the floor and free throw line, offensive rebounds, assists and turnovers.
+PTS = “Plus Points” is a measure of the points gained or lost by each player based on their efficiency in this game compared to league average efficiency on the same number of possessions. A player with an offensive rating (points produced per possession x 100) of 100 who uses 20 possessions would produce 20 points. If the league average efficiency is 114, the league — on average — would produced 22.8 points in the same 20 possessions. So, the player in this hypothetical would have a +PTS score of -2.8.

