Stats, analysis, commentary.
The Washington Wizards stayed competitive with the Minnesota Timberwolves through three quarter before getting blitzed in the final period to lose their seventh straight game.
For the Wizards, losing by “only” 14 was progress. They lost the last two by a combined 74 points.
Are we going to award them a highly coveted Moral Victory?
No.
They still got pummeled in that fourth quarter, gave up a monster game to Anthony Edwards, and watched Edwards score 20 points on 9 field goal attempts in the fourth.
They allowed Minnesota (ranked 20th in offense) an offensive rating (points scored per possession x 100) of 121 — a below average defensive performance. By “below average,” I mean even for the Wizards, not for the league at large. Washington entered the game with a league worst 119.9 defensive rating — 1.1 points per 100 possessions behind the 29th ranked Toronto Raptors.
On the offensive end, Washington was a bit better than their norm — they’re 107 offensive rating will slightly boost their season average. That average, by the way, is also 30th in the league — 1.8 points per 100 possessions behind the 29th ranked Charlotte Hornets.
Bright spots?
- Jonas Valanciunas had a “hey contending team that needs a big, trade for me” game, with 8 points, 8 rebounds, 4 assists and two steals in 19 minutes while going against Minnesota’s Rudy Gobert. Valanciunas was 4-4 from the floor and didn’t commit a turnovers.
- Alex Sarr was pretty good — 13 points, 3-5 from three, 5 assists, 2 steals, 2 blocks, 1 turnover. He took a hard fall trying to dunk on Naz Reid but got back up and played solidly the rest of the way.
- Kyshawn George had what was probably his best game of the season — 10 points on 4-7 shooting, including 2-5 from three — as well as 3 assists and 2 steals.
- The Wizards had 13 steals last night — one shy of their season high. They hit 14 steals twice this season: Nov. 8 in a loss to the Memphis Grizzlies, and Nov. 11 in a loss to the Houston Rockets.
Just spots?
- Let’s be clear about this: Kyle Kuzma did not play a good game…but it wasn’t the utter train wreck the last few have been. Yes, it was another sub-100 offensive rating (average is 113.3 so far this season), but he also had five rebounds, five assists, three steals, and just one turnover. That nets to a below average but still useful game.
- Jordan Poole played hard. He missed a few shots he’s made at a reasonable rate this season, and he set a new season high seven rebounds.
Not so bright spots?
- Jared Butler has been playing well the past few games. Head coach Brian Keefe “rewarded” him with just 7 minutes in the loss. Butler played pretty well again (even in the limited minutes).
- Justin Champagnie has been the team’s most productive player per possession over the past month. He got just 10 minutes last night.
- With Bub Carrington on the floor, the Wizards have been outscored by 111 points over the past five games. They were -17 in his 34 minutes last night.
Other stuff?
- Anthony Edwards had a 129 offensive rating while committing 7 turnovers. That’s downright amazing.
Four Factors
Below are the four factors that decide wins and losses in basketball — shooting (efg), rebounding (offensive rebounds), ball handling (turnovers), fouling (free throws made).
Stats & Metrics
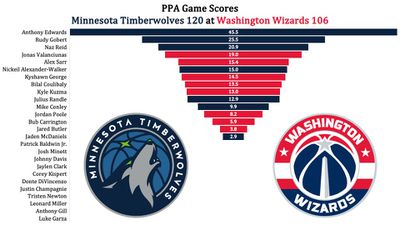
Below are a few performance metrics, including the Player Production Average (PPA) Game Score. PPA is my overall production metric, which credits players for things they do that help a team win (scoring, rebounding, playmaking, defending) and dings them for things that hurt (missed shots, turnovers, bad defense, fouls).
Game Score (GmSC) converts individual production into points on the scoreboard. The scale is the same as points and reflects each player’s total contributions for the game. The lowest possible GmSC is zero.
PPA is a per possession metric designed for larger data sets. In small sample sizes, the numbers can get weird. In PPA, 100 is average, higher is better and replacement level is 45. For a single game, replacement level isn’t much use, and I reiterate the caution about small samples sometimes producing weird results.
POSS is the number of possessions each player was on the floor in this game.
ORTG = offensive rating, which is points produced per individual possessions x 100. League average last season was 114.8. Points produced is not the same as points scored. It includes the value of assists and offensive rebounds, as well as sharing credit when receiving an assist.
USG = offensive usage rate. Average is 20%.
ORTG and USG are versions of stats created by former Wizards assistant coach Dean Oliver and modified by me. ORTG is an efficiency measure that accounts for the value of shooting, offensive rebounds, assists and turnovers. USG includes shooting from the floor and free throw line, offensive rebounds, assists and turnovers.
+PTS = “Plus Points” is a measure of the points gained or lost by each player based on their efficiency in this game compared to league average efficiency on the same number of possessions. A player with an offensive rating (points produced per possession x 100) of 100 who uses 20 possessions would produce 20 points. If the league average efficiency is 114, the league — on average — would produced 22.8 points in the same 20 possessions. So, the player in this hypothetical would have a +PTS score of -2.8.

by Kevin Broom
