Stats, commentary, analysis.
With Kyle Kuzma out of action with a groin injury, Washington Wizards head coach Brian Keefe opened the game with three rookies and a second-year man, and the team promptly sprinted out to an early lead. It was the youngest starting lineup in franchise history — a group so young that Jordan Poole served as the grizzled veteran, and he’s just 25.
All of the kids had stellar moments, though none had more than Bilal Coulibaly. The second-year wing followed up a dominating defensive performance Monday night against Trae Young (when Young was defended by Coulibaly, the Atlanta Hawks guard shot 0-7 from the floor and committed five turnovers in the previous game) with a hyper-efficient offensive game and more stellar defense.
Coulibaly shot 11-14 from the floor, 3-5 from three-point range, and tallied 3 steals and a block en route to 27 points (a new career high). As he kept making shots, he eschewed traditional heat checks and simply kept making the next right play. He finished the game with an offensive rating (points produced per possession x 100) of 161. League average so far this season is 112.7. His usage rate was 20.1%.
Coulibaly had plenty of help. Jonas Valanciunas couldn’t stop the Hawks from scoring inside, but he poured in 22 points on 10 field goal attempts, and grabbed 8 rebounds and handed out 6 assists in 25 minutes.
Rookie Bub Carrington — the NBA’s fourth youngest player this season — played a superb game — 16 points on 8 shots, 6 rebounds, 6 assists, and 2 turnovers. He defended effectively and got feisty when he absorbed a hard foul from former Wizards shooter Garrison Mathews.
Kyshawn George, the team’s oldest rookie (at 20 years old) was solid — 11 points on 10 shots, 4 assists, 3 steals and zero turnovers.
Alex Sarr, the team’s top pick in the 2024 draft, had some challenges finishing in the paint, but he knocked down a pair of threes and blocked four shots. In the fourth quarter, his presence near the rim deterred the Hawks from even attempting shots.
Jordan Poole’s game was a bit too much like last season for my liking. The controlled approach and smart decision making of the first three games was absent for long stretches. He shot just 6-17 from the floor and committed five turnovers. And yet, he connected on 4-9 from three-point range, produced 9 assists (exhibiting excellent synergy with Valanciunas) and had three steals.
It wasn’t an efficient night (109 offensive rating on 34.9% usage), but he had 24 points, 9 assists, and 3 steals. And the team was +14 when he was out there.
After getting harassed into a poor performance Monday night, Atlanta guard Trae Young bounced back with an efficient 35 points and 15 assists. It wasn’t close to enough for the injury-depleted Hawks to overcome the youthful energy, length, and athleticism of the Wizards.
Four Factors
Below are the four factors that decide wins and losses in basketball — shooting (efg), rebounding (offensive rebounds), ball handling (turnovers), fouling (free throws made).
Stats & Metrics
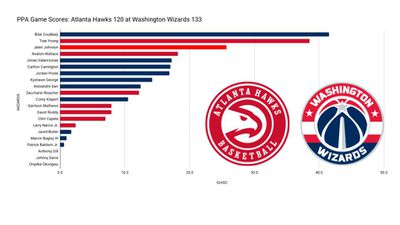
Below are a few performance metrics, including the Player Production Average (PPA) Game Score. PPA is my overall production metric, which credits players for things they do that help a team win (scoring, rebounding, playmaking, defending) and dings them for things that hurt (missed shots, turnovers, bad defense, fouls).
Game Score (GmSC) converts individual production into points on the scoreboard. The scale is the same as points and reflects each player’s total contributions for the game. The lowest possible GmSC is zero.
PPA is a per possession metric designed for larger data sets. In small sample sizes, the numbers can get weird. In PPA, 100 is average, higher is better and replacement level is 45. For a single game, replacement level isn’t much use, and I reiterate the caution about small samples sometimes producing weird results.
POSS is the number of possessions each player was on the floor in this game.
ORTG = offensive rating, which is points produced per individual possessions x 100. League average last season was 114.8. Points produced is not the same as points scored. It includes the value of assists and offensive rebounds, as well as sharing credit when receiving an assist.
USG = offensive usage rate. Average is 20%.
ORTG and USG are versions of stats created by former Wizards assistant coach Dean Oliver and modified by me. ORTG is an efficiency measure that accounts for the value of shooting, offensive rebounds, assists and turnovers. USG includes shooting from the floor and free throw line, offensive rebounds, assists and turnovers.
+PTS = “Plus Points” is a measure of the points gained or lost by each player based on their efficiency in this game compared to league average efficiency on the same number of possessions. A player with an offensive rating (points produced per possession x 100) of 100 who uses 20 possessions would produce 20 points. If the league average efficiency is 114, the league — on average — would produced 22.8 points in the same 20 possessions. So, the player in this hypothetical would have a +PTS score of -2.8.

