Stats, analysis, commentary.
The Washington Wizards seem to have a rule this season: only two players at a time can have a good game. Last night, it was Bub Carrington and Jonas Valanciunas. Others had some good moments but were missing in action for long stretches. Others were downright awful.
Carrington had another of his strong non-scoring games. He scored 10 points on 3-6 shooting, knocked down both his three points attempts and made his best contributions on defense — four steals and two blocks.
Valanciunas was his usual self — efficient scoring (10 points and 2 assists on 7 field goal attempts), 8 rebounds (including 3 offensive boards) and not much in the way of defensive contributions.
In the “flashes” department, Kyshawn George hit a couple threes. Corey Kispert looked like he was en route to a breakout game but went back to missing. Alex Sarr added a couple more blocked shots. He also shot 2-9 from the floor, went 0-3 from deep, and got thoroughly dominated by Rockets big man Alperen Sengun.
Sengun finished with 27 points on 19 shots, 17 rebounds (including 7 offensive boards), and had 3 assists and 3 steals. He opened the game by driving past Sarr for a dunk. He repeatedly scored on Sarr throughout the game. Washington eventually tried sending double-teams, which were generally too slow to be effective. Sarr has to learn from this kind of experience to be the kind of impact defender the team believes he can be.
Bright side: the Wizards didn’t lose by 20+ points for a fifth time this season. They trailed by as much as 20 points, but the final margin was 15.
The biggest negatives worth mention were Kyle Kuzma’s stultifying performance in his first game back from injury, and Jordan Poole’s sloppy, wasteful game.
Returning from a groin injury that kept him out of action the past two weeks, Kuzma led the team in field goal attempts despite playing just 24 minutes. He finished the night 7-18 from the floor, and 3-8 from deep. He had three turnovers and zero assists. His usage rate was a sky-high 34.6% with an offensive rating of 81. League average this season: 113.1.
Poole played worse — 11 points on 5-14 shooting, 1-5 from three-point range. Poole did produce 5 rebounds, 6 assists and 4 steals, but his reckless play and haphazard decision making resulted in 8 costly turnovers.
Kuzma and Poole combined for an offensive rating of 69. Their teammates had a combined offensive rating of 106. The team’s full offensive rating: 92.
With Kuzma and Poole burning possessions, there weren’t as many left for their teammates. Carrington had a 149 offensive rating and a usage rate of 12.6%. Bilal Coulibaly got off to a decent start but finished with a 96 offensive rating and a usage rate of 14.1%. George had a 105 offensive rating and a 15.0% usage rate.
The only rotation player besides Kuzma and Poole to top 18% usage was Valanciunas at 21.5% (and an offensive rating of 150).
This is not to blame Kuzma and Poole for the loss. It was a team effort. The Rockets entered the game as the NBA’s best offensive rebounding team; the Wizards were last in defensive rebounding. Houston shot poorly but to 17 offensive rebounds — an offensive rebounding percentage of 39.5%. League average is about 25%.
While Houston laid bricks (just 5-23 from three-point range), they still outshot Washington, grabbed more offensive boards, and won at the free throw line (22-9). The Wizards “won” the turnover battle with 18 turnovers to Houston’s 19. Washington’s defense wasn’t bad, despite the stellar game from Sengun. Their offense was atrocious.
Next up for the Wizards: Victor Wembanyama and the San Antonio Spurs.
Four Factors
Below are the four factors that decide wins and losses in basketball — shooting (efg), rebounding (offensive rebounds), ball handling (turnovers), fouling (free throws made).
Stats & Metrics
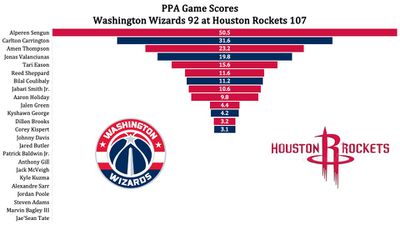
Below are a few performance metrics, including the Player Production Average (PPA) Game Score. PPA is my overall production metric, which credits players for things they do that help a team win (scoring, rebounding, playmaking, defending) and dings them for things that hurt (missed shots, turnovers, bad defense, fouls).
Game Score (GmSC) converts individual production into points on the scoreboard. The scale is the same as points and reflects each player’s total contributions for the game. The lowest possible GmSC is zero.
PPA is a per possession metric designed for larger data sets. In small sample sizes, the numbers can get weird. In PPA, 100 is average, higher is better and replacement level is 45. For a single game, replacement level isn’t much use, and I reiterate the caution about small samples sometimes producing weird results.
POSS is the number of possessions each player was on the floor in this game.
ORTG = offensive rating, which is points produced per individual possessions x 100. League average last season was 114.8. Points produced is not the same as points scored. It includes the value of assists and offensive rebounds, as well as sharing credit when receiving an assist.
USG = offensive usage rate. Average is 20%.
ORTG and USG are versions of stats created by former Wizards assistant coach Dean Oliver and modified by me. ORTG is an efficiency measure that accounts for the value of shooting, offensive rebounds, assists and turnovers. USG includes shooting from the floor and free throw line, offensive rebounds, assists and turnovers.
+PTS = “Plus Points” is a measure of the points gained or lost by each player based on their efficiency in this game compared to league average efficiency on the same number of possessions. A player with an offensive rating (points produced per possession x 100) of 100 who uses 20 possessions would produce 20 points. If the league average efficiency is 114, the league — on average — would produced 22.8 points in the same 20 possessions. So, the player in this hypothetical would have a +PTS score of -2.8.

