Stats, commentary, analysis
Once again, the Washington Wizards took on a strong Eastern Conference team, and once again they got blasted. This time, it was the Cleveland Cavaliers delivering the beating.
Any semblance of genuine competition was gone midway through the third period. Cleveland’s lead climbed as high as 27 in the fourth quarter before they turned things over to the mop-up crew and went home with a 19-point win.
Washington’s offensive process was fine. When they executed the scheme, they got decent shots, which they didn’t convert at a high rate. When they (cough…Kuzma…cough-cough) forced the action, they got shots that were beyond the capabilities of their players to make with any regularity.
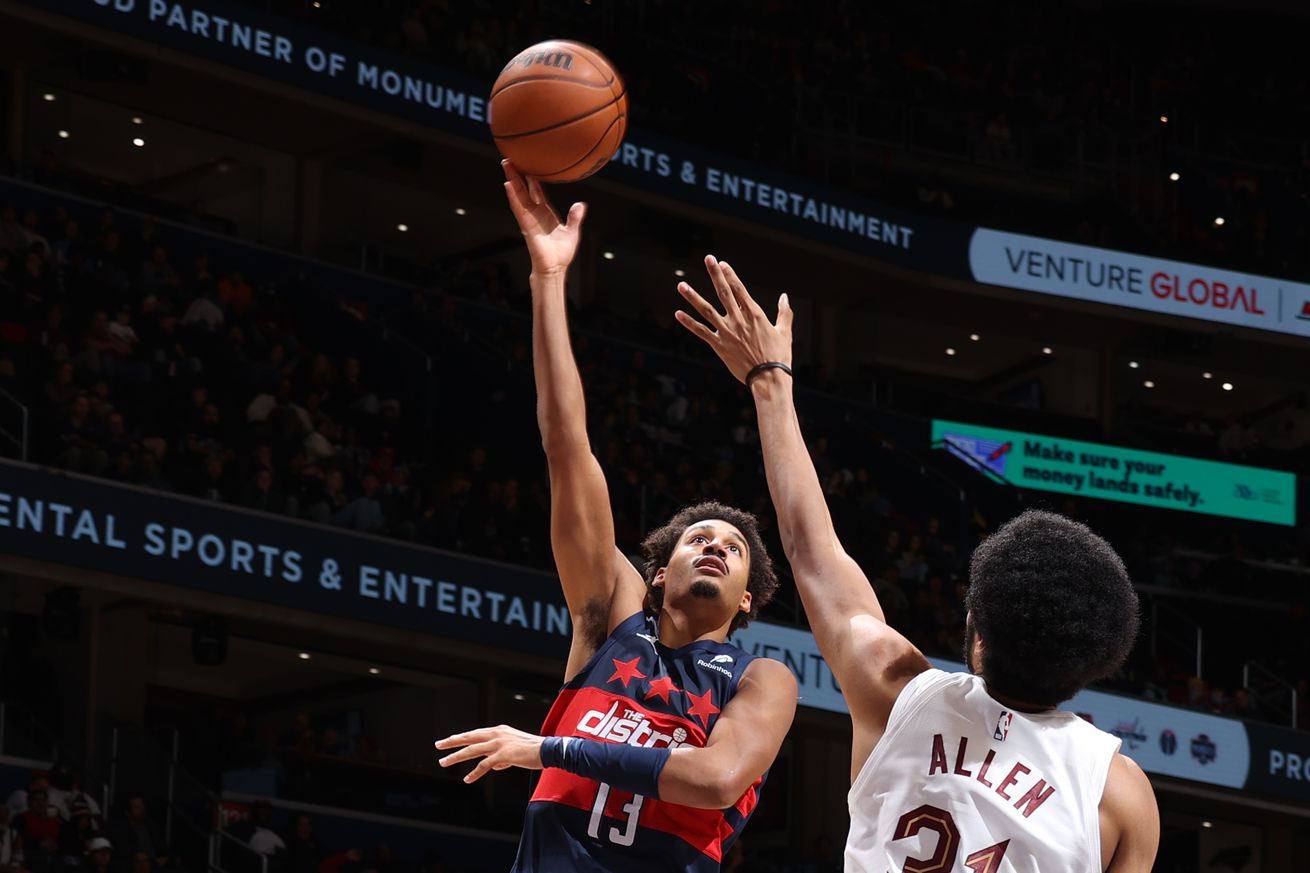
After the first quarter, their defense was a mess. Cleveland got free runs at the rim and open threes. Jarrett Allen took Wizards rookie Alex Sarr to school with basic moves and actions that produced easy dunks and layups.
The Wizards had three main bright spots on the night:
- Bilal Coulibaly posted a career high 23 points with a balanced and efficient offensive game. He took threes, attacked the basket when he had an advantage but wasn’t overly aggressive or forcing shots.
- Jordan Poole had another productive and efficient night. He played a contained and fairly disciplined game — nine shots, six assists, three steals, one turnover.
- While getting schooled, Sarr still had a solidly productive game — 12 points on 10 shots, a pair of threes, six rebounds, and two blocks.
On the wrong side of the ledger was Kyle Kuzma, who finished 3-16 from the floor and missed all four of his three-point attempts. He’s now 0-9 to start the year from deep. Kuzma did help out with eight rebounds (including three offensive) and three assists in 24 minutes. As others have noted, Kuzma looks slower and heavier this season than he did in previous years.
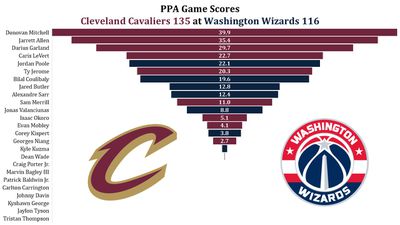
As I said during the Bullets Forever Playback stream with Matt Modderno, Cleveland’s roster if vastly more talented than Washington’s. The Cavaliers have a minimum of four players who are better than anyone on the Wizards roster — arguably as many as six. That showed throughout the night, especially with Donovan Mitchell, Jarrett Allen, and Darius Garland. It didn’t help that inept Washington defense made Caris LeVert and Ty Jerome look like All-Stars.
Four Factors
Below are the four factors that decide wins and losses in basketball — shooting (efg), rebounding (offensive rebounds), ball handling (turnovers), fouling (free throws made).
Stats & Metrics
Below are a few performance metrics, including the Player Production Average (PPA) Game Score. PPA is my overall production metric, which credits players for things they do that help a team win (scoring, rebounding, playmaking, defending) and dings them for things that hurt (missed shots, turnovers, bad defense, fouls).
Game Score (GmSC) converts individual production into points on the scoreboard. The scale is the same as points and reflects each player’s total contributions for the game. The lowest possible GmSC is zero.
PPA is a per possession metric designed for larger data sets. In small sample sizes, the numbers can get weird. In PPA, 100 is average, higher is better and replacement level is 45. For a single game, replacement level isn’t much use, and I reiterate the caution about small samples sometimes producing weird results.
POSS is the number of possessions each player was on the floor in this game.
ORTG = offensive rating, which is points produced per individual possessions x 100. League average last season was 114.8. Points produced is not the same as points scored. It includes the value of assists and offensive rebounds, as well as sharing credit when receiving an assist.
USG = offensive usage rate. Average is 20%.
ORTG and USG are versions of stats created by former Wizards assistant coach Dean Oliver and modified by me. ORTG is an efficiency measure that accounts for the value of shooting, offensive rebounds, assists and turnovers. USG includes shooting from the floor and free throw line, offensive rebounds, assists and turnovers.
+PTS = “Plus Points” is a measure of the points gained or lost by each player based on their efficiency in this game compared to league average efficiency on the same number of possessions. A player with an offensive rating (points produced per possession x 100) of 100 who uses 20 possessions would produce 20 points. If the league average efficiency is 114, the league — on average — would produced 22.8 points in the same 20 possessions. So, the player in this hypothetical would have a +PTS score of -2.8.
