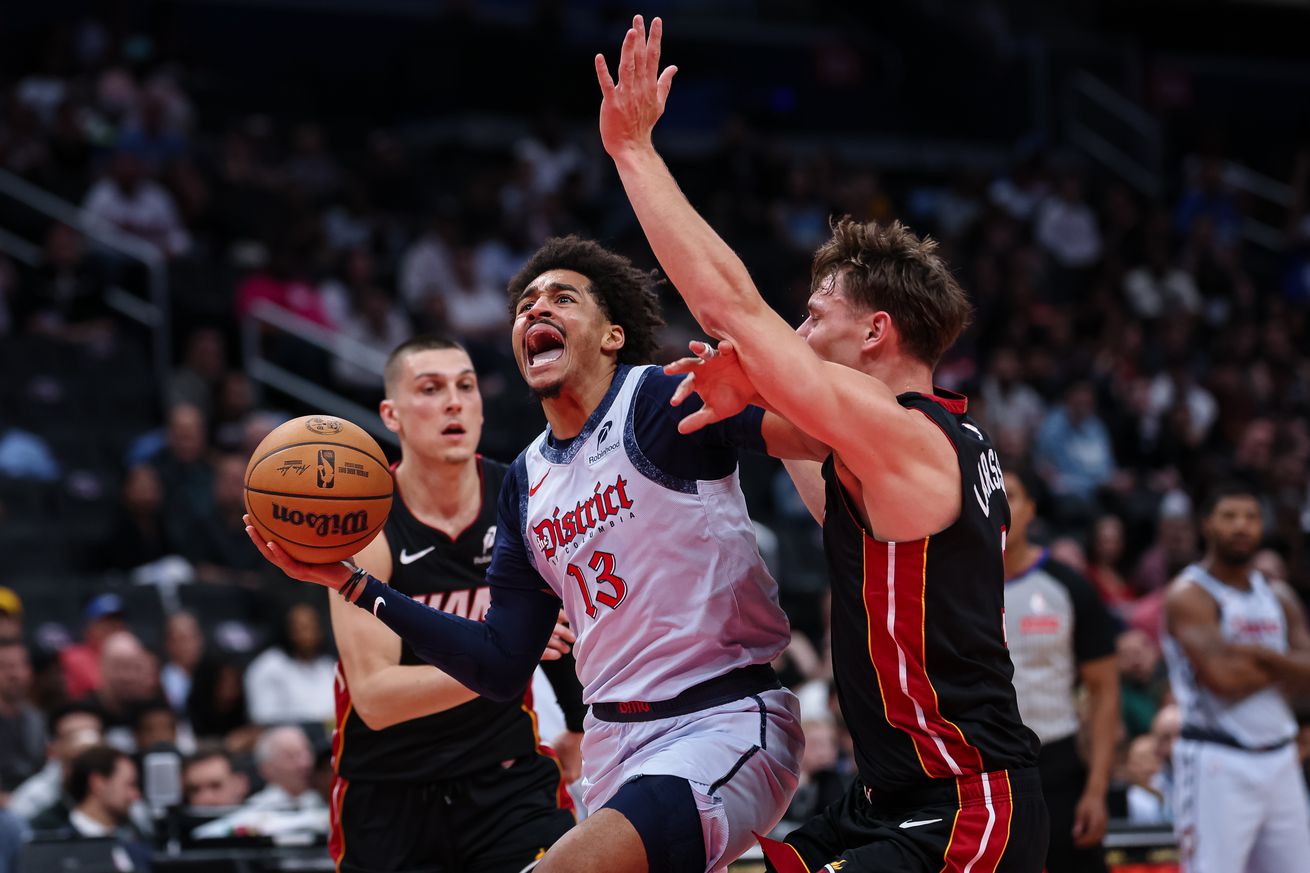
Stats, analysis, commentary.
At least they didn’t lose by 53 again. This time — against the Miami Heat — Washington lost by 26 despite Miami just 28.1% from three-point range.
It’s the Wizards’ 23rd loss this season by 20 or more points.
If you didn’t watch this one, I congratulate you for your mental health. If you bailed early, I commend your decision-making. If you stayed to the final buzzer, I welcome you to the Wizards Bandwagon. What else are we to do on a Monday night in March?
On Playback, turns out we did find something else to do — in this instance, an ersatz NBA tanking Red Zone where Greg Finberg and I switched back and forth from the Wizards to the Utah Jazz vs. Charlotte Hornets, and the Sacramento Kings vs. the Indiana Pacers. Utah managed to lose again, by the way.
The TLDR on this one: Jordan Poole and Richaun Holmes were terrific, and everyone else basically stunk. The one sorta exception being Bub Carrington who had 8 rebounds, 9 assists and 3 steals…but couldn’t make shots (just 3-11 from the floor).
The Section Usually Called “Bright Spots for the Wizards” but for Last Night Will Be Called “Observations”
- Jordan Poole scored 35 points in 29 minutes and used just 17 shots to do it. He continues to be one of the league’s best extreme range shooters, and he made a few more 28+ footers last night.
- Richaun Holmes continued to put things on film that will keep in him the NBA next season. Someone will be happy to have him as a backup big for the next season or two, albeit probably at a lower salary number than his current contract with Washington is slated to pay him. He had 8 points and 8 rebounds in 15 minutes and had a handful of excellent defensive plays.
- Poole (151 offensive rating) and Holmes (163) were the only Washington players with an offensive rating about 100. League average is 114.5 so far this season. They’re also the only Wizards to crack 90. The next “most efficient” player was Justin Champagnie with an 84 ortg. Yikes.
- Justin Champagnie had three blocks.
- Alex Sarr had an abysmal game — 3-17 from the floor, 1-7 from three, just 3 rebounds and 3 assists in 31 minutes. And two turnovers and five fouls.
- Washington posted an offensive rating of 90 — tied for the team’s fourth worst mark of the season.
- The Heat won all four factors — shooting from the floor, offensive rebounding, turnovers (by just one, but still), and free throws.
Four Factors
Below are the four factors that decide wins and losses in basketball — shooting (efg), rebounding (offensive rebounds), ball handling (turnovers), fouling (free throws made).
The four factors are measured by:
- eFG% (effective field goal percentage, which accounts for the three-point shot)
- OREB% (offensive rebound percentage)
- TOV% (turnover percentage — turnovers divided by possessions)
- FTM/FGA (free throws made divided by field goal attempts)
In the table below are the four factors using the percentages and rates traditionally presented. There’s also a column showing league average in each of the categories to give a sense of each team’s performance relative to the rest of the league this season.
Stats & Metrics
Below are a few performance metrics. PPA is my overall production metric, which credits players for things they do that help a team win (scoring, rebounding, playmaking, defending) and dings them for things that hurt (missed shots, turnovers, bad defense, fouls).
PPA is a per possession metric designed for larger data sets. In small sample sizes, the numbers can get weird. In PPA, 100 is average, higher is better and replacement level is 45. For a single game, replacement level isn’t much use, and I reiterate the caution about small samples sometimes producing weird results.
POSS is the number of possessions each player was on the floor in this game.
ORTG = offensive rating, which is points produced per individual possessions x 100. League average last season was 114.8. Points produced is not the same as points scored. It includes the value of assists and offensive rebounds, as well as sharing credit when receiving an assist.
USG = offensive usage rate. Average is 20%.
ORTG and USG are versions of stats created by former Wizards assistant coach Dean Oliver and modified by me. ORTG is an efficiency measure that accounts for the value of shooting, offensive rebounds, assists and turnovers. USG includes shooting from the floor and free throw line, offensive rebounds, assists and turnovers.
+PTS = “Plus Points” is a measure of the points gained or lost by each player based on their efficiency in this game compared to league average efficiency on the same number of possessions. A player with an offensive rating (points produced per possession x 100) of 100 who uses 20 possessions would produce 20 points. If the league average efficiency is 114, the league — on average — would produced 22.8 points in the same 20 possessions. So, the player in this hypothetical would have a +PTS score of -2.8.
Players are sorted by total production in the game.