Stats, analysis, commentary
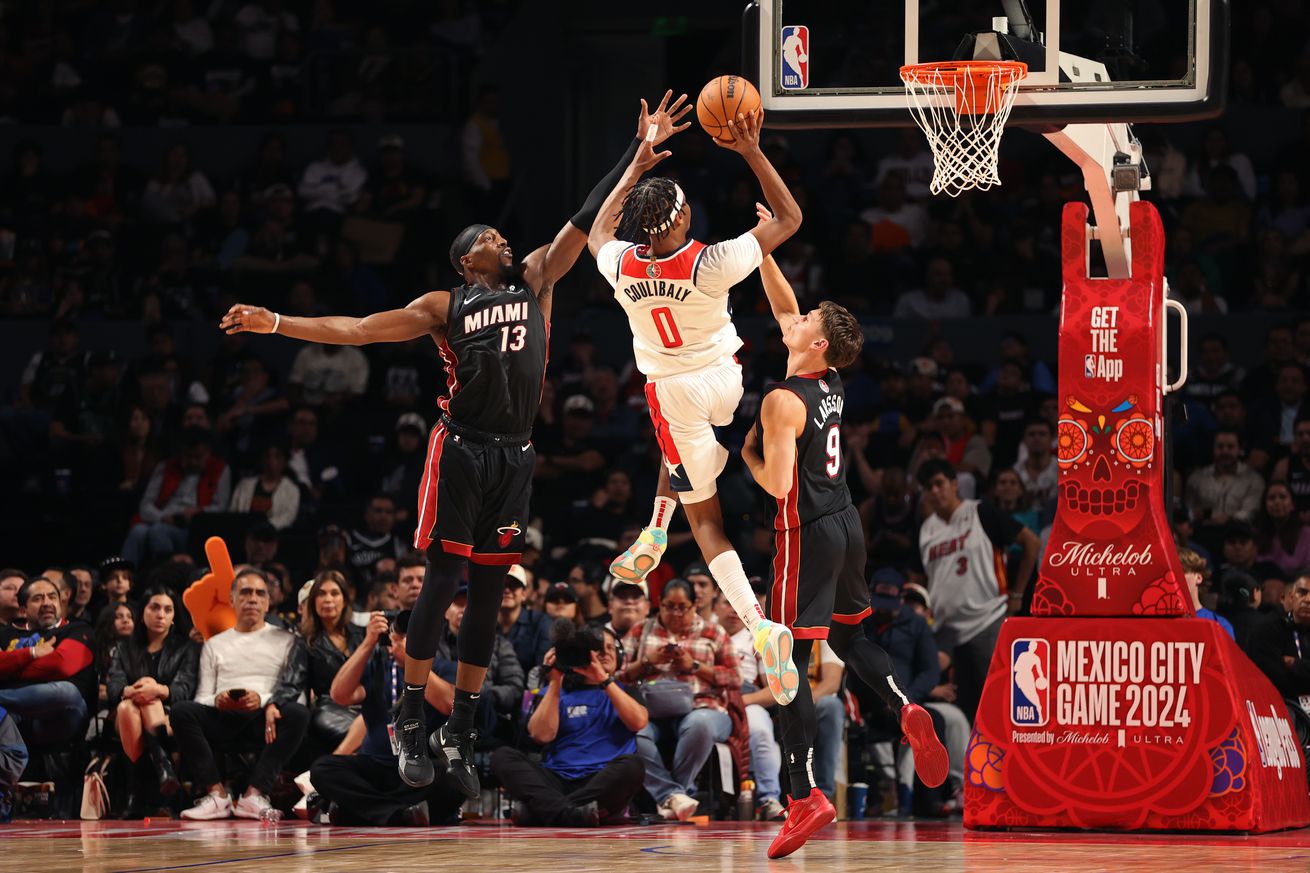
Games like this are why you have to savor things like the two-game winning streak against the Atlanta Hawks. Last night in Mexico City, the Washington Wizards took on a well-coached, reasonably talented, and mostly healthy Miami Heat and got smoked, 118-98.
This is normal and fine. Young players on rebuilding teams are usually inconsistent — sometimes excellent and other times awful. Seasons like the 2024-25 campaign are an opportunity to help players who might be part of the team when it’s competitive learn to be both good and consistent. As the Wizards front office leaders have said, you can’t skip steps.
While the Wizards took their lumps against the Heat, there were some genuine positives. Chief among these was another efficient and effective performance from 20-year-old wing Bilal Coulibaly. He finished with 22 points on 12 shots, hit both his threes, grabbed eight boards, and committed zero turnovers.
To get nitpicky, I’d like to see Coulibaly exhibit more aggression on the offensive end in the first half when the outcome is still in doubt. There isn’t much reason I can see for him to be lower on the offensive pecking order than older teammates like Jordan Poole, Jonas Valanciunas, or Kyle Kuzma (when he returns from his groin injury). Last night, Coulibaly had an offensive rating of 153 with a usage rate of 19.2%. That’s hyper-efficient with basically average possession usage.
This is not an argument for spamming Coulibaly possessions. With a bigger offensive role, some of that efficiency would be reduced. Still, there’s a lot of room to leak efficiency while ramping up usage, and plenty he could learn by carrying a heavier burden. Plus, it should be relatively easy to redistribute possessions from guys who don’t matter much to the franchise’s future.
Another overall positive was rookie big man Alex Sarr, who scored 17 points on 11 shots, grabbed six rebounds, and blocked 4 shots against the Heat. He had a tough time handling the newest version of Bam Adebayo (shooting threes, attacking offensively), but overall played well.
Rookie guard Bub Carrington shot poorly (2-9 from the floor, 0-5 from three) but handed out 8 assists (to zero turnovers) and had four steals.
Johnny Davis had probably his best game as a pro — 9 points on 4-5 shooting from the floor, 7 rebounds in 18 minutes. His entire game was at the rim, which is fine — he at least contributed on the offensive end — but did nothing to suggest he should stick in the NBA beyond this season.
Jordan Poole played his worst game of the season — 8-18 from the floor, 2-8 from deep, zero rebounds, 3 assists, 2 turnovers. He gave a solid defensive effort with two steals and two blocks. Considering he’d shot 57.1% from three over the first four games, he was due for one like this. Hopefully he bounces back Monday against his old team, the Golden State Warriors.
Four Factors
Below are the four factors that decide wins and losses in basketball — shooting (efg), rebounding (offensive rebounds), ball handling (turnovers), fouling (free throws made).
Stats & Metrics
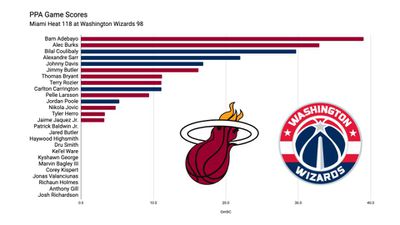
Below are a few performance metrics, including the Player Production Average (PPA) Game Score. PPA is my overall production metric, which credits players for things they do that help a team win (scoring, rebounding, playmaking, defending) and dings them for things that hurt (missed shots, turnovers, bad defense, fouls).
Game Score (GmSC) converts individual production into points on the scoreboard. The scale is the same as points and reflects each player’s total contributions for the game. The lowest possible GmSC is zero.
PPA is a per possession metric designed for larger data sets. In small sample sizes, the numbers can get weird. In PPA, 100 is average, higher is better and replacement level is 45. For a single game, replacement level isn’t much use, and I reiterate the caution about small samples sometimes producing weird results.
POSS is the number of possessions each player was on the floor in this game.
ORTG = offensive rating, which is points produced per individual possessions x 100. League average last season was 114.8. Points produced is not the same as points scored. It includes the value of assists and offensive rebounds, as well as sharing credit when receiving an assist.
USG = offensive usage rate. Average is 20%.
ORTG and USG are versions of stats created by former Wizards assistant coach Dean Oliver and modified by me. ORTG is an efficiency measure that accounts for the value of shooting, offensive rebounds, assists and turnovers. USG includes shooting from the floor and free throw line, offensive rebounds, assists and turnovers.
+PTS = “Plus Points” is a measure of the points gained or lost by each player based on their efficiency in this game compared to league average efficiency on the same number of possessions. A player with an offensive rating (points produced per possession x 100) of 100 who uses 20 possessions would produce 20 points. If the league average efficiency is 114, the league — on average — would produced 22.8 points in the same 20 possessions. So, the player in this hypothetical would have a +PTS score of -2.8.
