Stats, commentary, analysis
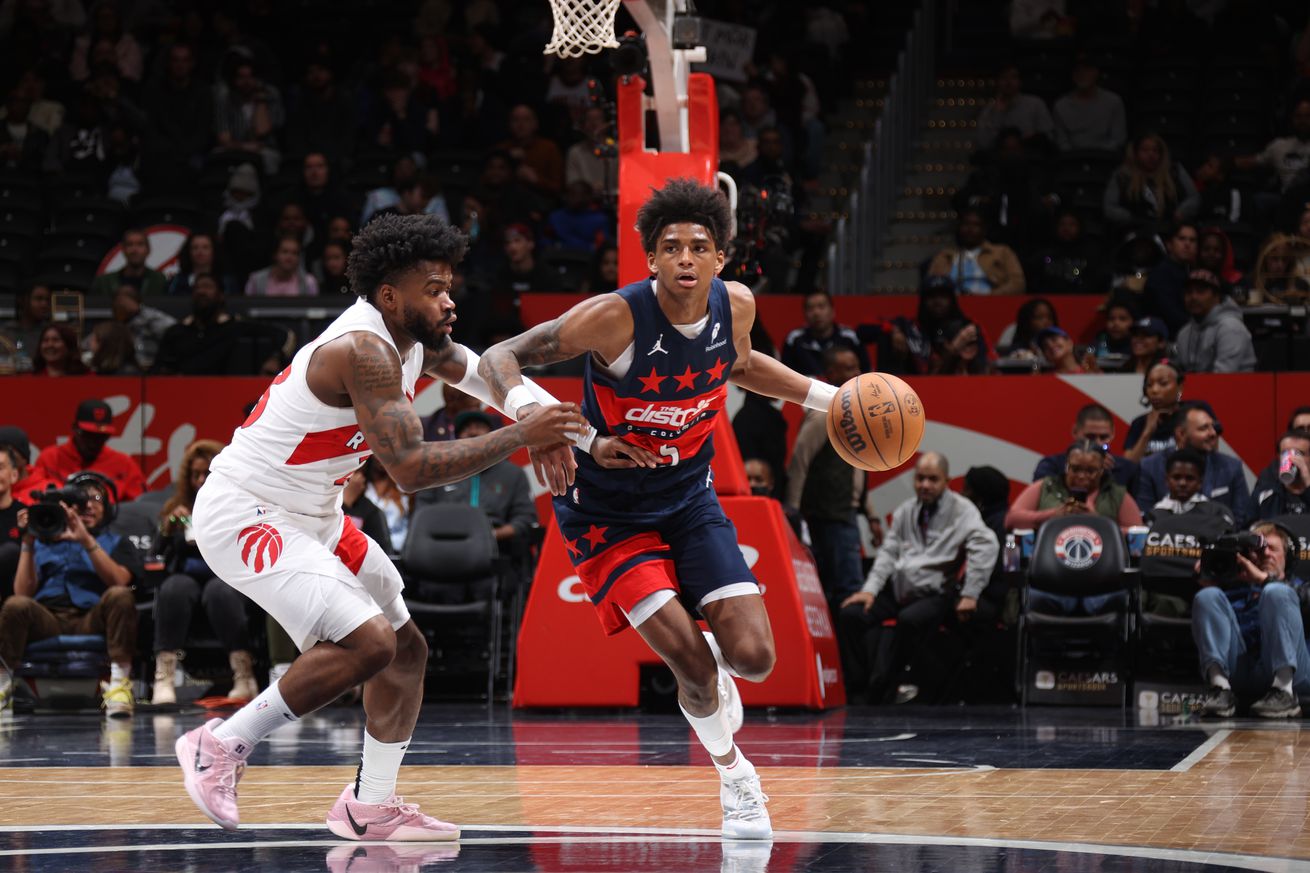
Last night’s contest between the Washington Wizards and Toronto Raptors pitted two of the NBA’s worst offensive teams against each other, and it showed. A fast pace (107 possessions each) inflated the total to 216 points — two teams playing a game at that pace and average NBA efficiency would have scored 245.
Was it ugly? Well, the Wizards shot just 29.7% from three-point range…and the Raptors somehow shot even a little worse (27.8%). Both teams also shot below 50% on twos.
No, the poor shooting was not because of stellar defense. Both teams had plenty of open looks. They just missed. A lot.
Toronto won because they grabbed offensive boards (the Wizards did not) and avoided turnovers (the Wizards did not).
Bright side: Another loss is exactly what Washington needed as they cling to a slender lead over the Utah Jazz for worst record. The Wizards are 15-56 — Utah is 16-56.
Wizards head coach Brian Keefe seems to understand the job. To start the fourth quarter, Keefe had a lineup of Colby Jones (age 22), AJ Johnson (20), Tristan Vukcevic (22), JT Thor (22), and Marcus Smart (31). Just two minutes in, he subbed out Smart for Bub Carrington (19). His only other lineup change: Alex Sarr (19) for Thor.
Yes, Washington’s lineup over the final seven minutes of the game had an average age of 20.4 years old. This is good.
Bright Spots for the Wizards
- Secured the loss and maintained that lead on the Jazz.
- Closed the game with an ultra-young lineup.
- AJ Johnson was good — 17 points on 9 shots, 6 rebounds, 3 assists, just 1 turnover in 28 minutes. He had a couple more lob finishes and continues to make exciting plays with eye-popping athleticism. He was also the only Wizards player with more than two minutes of playing time and an above average offensive rating.
- Jordan Poole shot well — 8-13 from the floor and 5-9 from three en route to 23 points in 22 minutes. You may wonder how a guy with 80.8% eFG% and a usage rate of 33.3% can finish with an offensive rating of just 114. Answer: five turnovers in 22 minutes. That’s a 31.0% turnover rate.
- Alex Sarr had three blocks in an otherwise thoroughly forgettable game.
- JT Thor had a terrific dunk in transition.
One piece of bad news: rookie Kyshawn George landed on Jakob Poeltl’s foot while leaping for a rebound and turned his ankle just two minutes into the game. He did not return.
Four Factors
Below are the four factors that decide wins and losses in basketball — shooting (efg), rebounding (offensive rebounds), ball handling (turnovers), fouling (free throws made).
The four factors are measured by:
- eFG% (effective field goal percentage, which accounts for the three-point shot)
- OREB% (offensive rebound percentage)
- TOV% (turnover percentage — turnovers divided by possessions)
- FTM/FGA (free throws made divided by field goal attempts)
In the table below are the four factors using the percentages and rates traditionally presented. There’s also a column showing league average in each of the categories to give a sense of each team’s performance relative to the rest of the league this season.
Stats & Metrics
Below are a few performance metrics. PPA is my overall production metric, which credits players for things they do that help a team win (scoring, rebounding, playmaking, defending) and dings them for things that hurt (missed shots, turnovers, bad defense, fouls).
PPA is a per possession metric designed for larger data sets. In small sample sizes, the numbers can get weird. In PPA, 100 is average, higher is better and replacement level is 45. For a single game, replacement level isn’t much use, and I reiterate the caution about small samples sometimes producing weird results.
POSS is the number of possessions each player was on the floor in this game.
ORTG = offensive rating, which is points produced per individual possessions x 100. League average last season was 114.8. Points produced is not the same as points scored. It includes the value of assists and offensive rebounds, as well as sharing credit when receiving an assist.
USG = offensive usage rate. Average is 20%.
ORTG and USG are versions of stats created by former Wizards assistant coach Dean Oliver and modified by me. ORTG is an efficiency measure that accounts for the value of shooting, offensive rebounds, assists and turnovers. USG includes shooting from the floor and free throw line, offensive rebounds, assists and turnovers.
+PTS = “Plus Points” is a measure of the points gained or lost by each player based on their efficiency in this game compared to league average efficiency on the same number of possessions. A player with an offensive rating (points produced per possession x 100) of 100 who uses 20 possessions would produce 20 points. If the league average efficiency is 114, the league — on average — would produced 22.8 points in the same 20 possessions. So, the player in this hypothetical would have a +PTS score of -2.8.
Players are sorted by total production in the game.