Stats, analysis, commentary
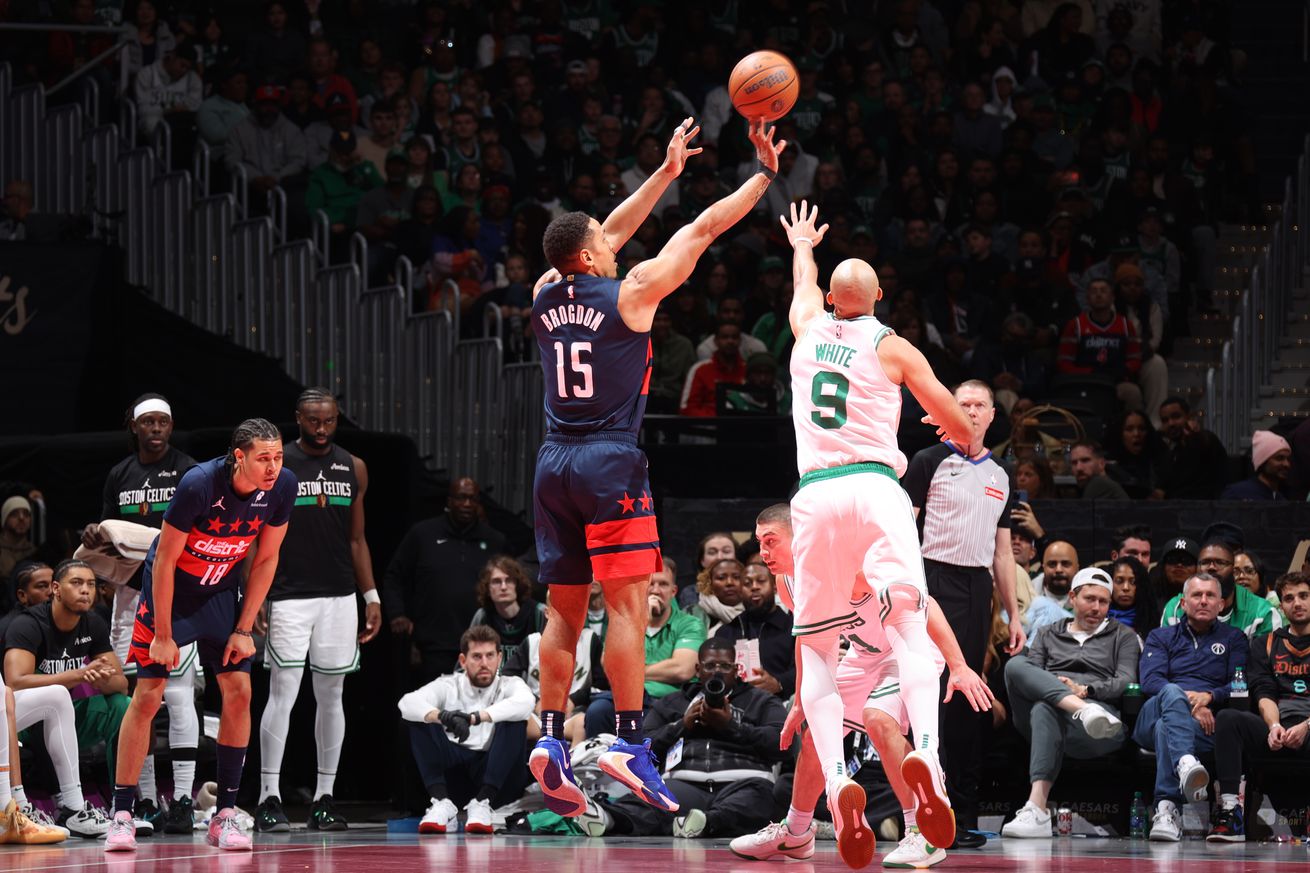
The Wizards went into last night’s game outmatched by the defending champion Boston Celtics, even though the Celtics were missing their starting center, and his backup. They played hard, though not well, and Boston played maybe their worst game of the season, and the Celtics still left town with a 12-point win.
Both teams played hard?
The esthetics of this one were not beautiful. The teams combined to shoot 18-74 on threes — 24.3%. This wasn’t a case of one team shooting almost decent, and the other laying bricks. Washington was 7-28 (25.0%) from three. Boston was 11-46 (23.9%).
The Wizards lost because of turnovers (they had 19 to Boston’s 12), and their inability to stop fouling. Boston ended up with twice as many free throw attempts.
And no, this wasn’t a case of the refs showing favoritism. Boston entered the game number one in defensive free throw rate (in other words, allowing the fewest opponent free throws); the Wizards were 26th.
While I’m a bit less encouraged by last night’s game than most seemed to be in the Playback and the broadcast, the Wizards still had some bright spots.
- Bilal Coulibaly had a poor overall game, but he defended well against Boston star Jayson Tatum and played a major role in Tatum’s atrocious production.
- Alex Sarr had nine rebounds and a block in 28 minutes.
- Malcolm Brogdon scored 18 points on 13 shots and grabbed 10 rebounds — a classic veteran boost your trade value kind of performance.
- Jordan Poole made some threes and made up for four turnovers with eight assists. He probably could have had a couple more if teammates didn’t miss highly makable shots.
- Jonas Valanciunas notched 11 points and 10 rebounds in just 19 minutes of action.
- Kyle Kuzma didn’t force shots and constrained himself to 21.9% usage.
- Their Emirates NBA Cup court looked good, as did their city edition uniforms.
They also had some less than bright spots.
- The 6-9 Kuzma had three rebounds and one assist in nearly 35 minutes. In fairness, he might have had one or two more when he made good passes to open teammates who missed.
- Sarr needs remedial work in making shots. He was 3-9 from the floor and missed two more threes.
- After shooting 1-5 from the floor in the first quarter, Coulibaly largely disappeared from the offense. On several possessions, he drove into the paint and gained advantage on a defender only to turn down shot opportunities to pass the ball out to teammates. One of Carrington’s missed threes was a grenade tossed to him by Coulibaly.
- None of the kids did more than flash potential here or there. In 110 combined minutes, they shot 6-27 from the floor, 2-14 from three, had 20 rebounds, 6 assists, 3 steals, 3 blocks, 7 turnovers, 12 fouls, and 17 points. Their combined offensive rating (individual points produced per individual possession x 100) was 63.
The loss drops Washington to 2-12 and last place in the Eastern Conference.
Four Factors
Below are the four factors that decide wins and losses in basketball — shooting (efg), rebounding (offensive rebounds), ball handling (turnovers), fouling (free throws made).
Stats & Metrics
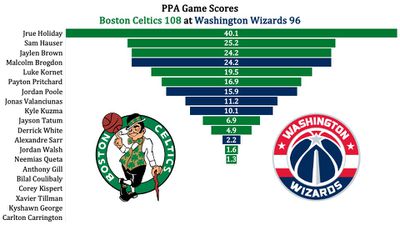
Below are a few performance metrics, including the Player Production Average (PPA) Game Score. PPA is my overall production metric, which credits players for things they do that help a team win (scoring, rebounding, playmaking, defending) and dings them for things that hurt (missed shots, turnovers, bad defense, fouls).
Game Score (GmSC) converts individual production into points on the scoreboard. The scale is the same as points and reflects each player’s total contributions for the game. The lowest possible GmSC is zero.
PPA is a per possession metric designed for larger data sets. In small sample sizes, the numbers can get weird. In PPA, 100 is average, higher is better and replacement level is 45. For a single game, replacement level isn’t much use, and I reiterate the caution about small samples sometimes producing weird results.
POSS is the number of possessions each player was on the floor in this game.
ORTG = offensive rating, which is points produced per individual possessions x 100. League average last season was 114.8. Points produced is not the same as points scored. It includes the value of assists and offensive rebounds, as well as sharing credit when receiving an assist.
USG = offensive usage rate. Average is 20%.
ORTG and USG are versions of stats created by former Wizards assistant coach Dean Oliver and modified by me. ORTG is an efficiency measure that accounts for the value of shooting, offensive rebounds, assists and turnovers. USG includes shooting from the floor and free throw line, offensive rebounds, assists and turnovers.
+PTS = “Plus Points” is a measure of the points gained or lost by each player based on their efficiency in this game compared to league average efficiency on the same number of possessions. A player with an offensive rating (points produced per possession x 100) of 100 who uses 20 possessions would produce 20 points. If the league average efficiency is 114, the league — on average — would produced 22.8 points in the same 20 possessions. So, the player in this hypothetical would have a +PTS score of -2.8.

