The stats and analysis aren’t too bad all things considered.
I’m not one for moral victories, and I’m not awarding one to the Washington Wizards. They got thumped by the Golden State Warriors, who have been much better than most anticipated this season. The final margin was 13 points, which doesn’t adequately convey how much better the Warriors were.
But, as Gabe Ibrahim, my Playback partner for the night pointed out, it was still a good loss for the Wizards. Here’s why, by the numbers:
- More than half the team’s minutes went to players age 20 or under. Bilal Coulibaly (20) got 39 minutes. Kyshawn George (20) got 38. Bub Carrington (19) played 33. Alex Sarr (19) got 27. Each of them had rough moments and good ones. Each of them got a chance to get schooled by some of the best players the game has ever seen (Stephen Curry and Draymond Green) and not back down.
- George transmogrified a horror show performance into a pretty good by shattering the lid that has been on the basket for him all season. He entered the game shooting 2-20 from three-point range. He missed his first six attempts. I told Playback listeners that at some point, George was going to make one and then go on a three-point binge. He then connected on six of his next seven. He also had six rebounds and four assists to just one turnover.
- Jordan Poole shot poorly (8-20 from the floor, 2-10 from deep) but continued being a disruptive defender. Last night: three more steals and four blocks. On offense, his decision-making improved as the game went on. On one play in the fourth quarter, he made exactly the kind of dancing dribble move that would have inevitably ended in a stepback three-point attempt. He turned down the shot to pass the ball to a more open teammate. Right play, right decision — real growth.
- Sarr struggled from the field but turned in the first double-double of his career — 10 points and 11 rebounds. He also continued his strong defense with three more blocks.
- Carrington was efficient offensively and delivered eight rebounds, seven assists and just one turnover. His defense isn’t there yet, but he’s competitive, and the team desperately needs someone to grab defensive boards.
- Jared Butler made the most of his eight minutes — seven points on four shots plus three assists.
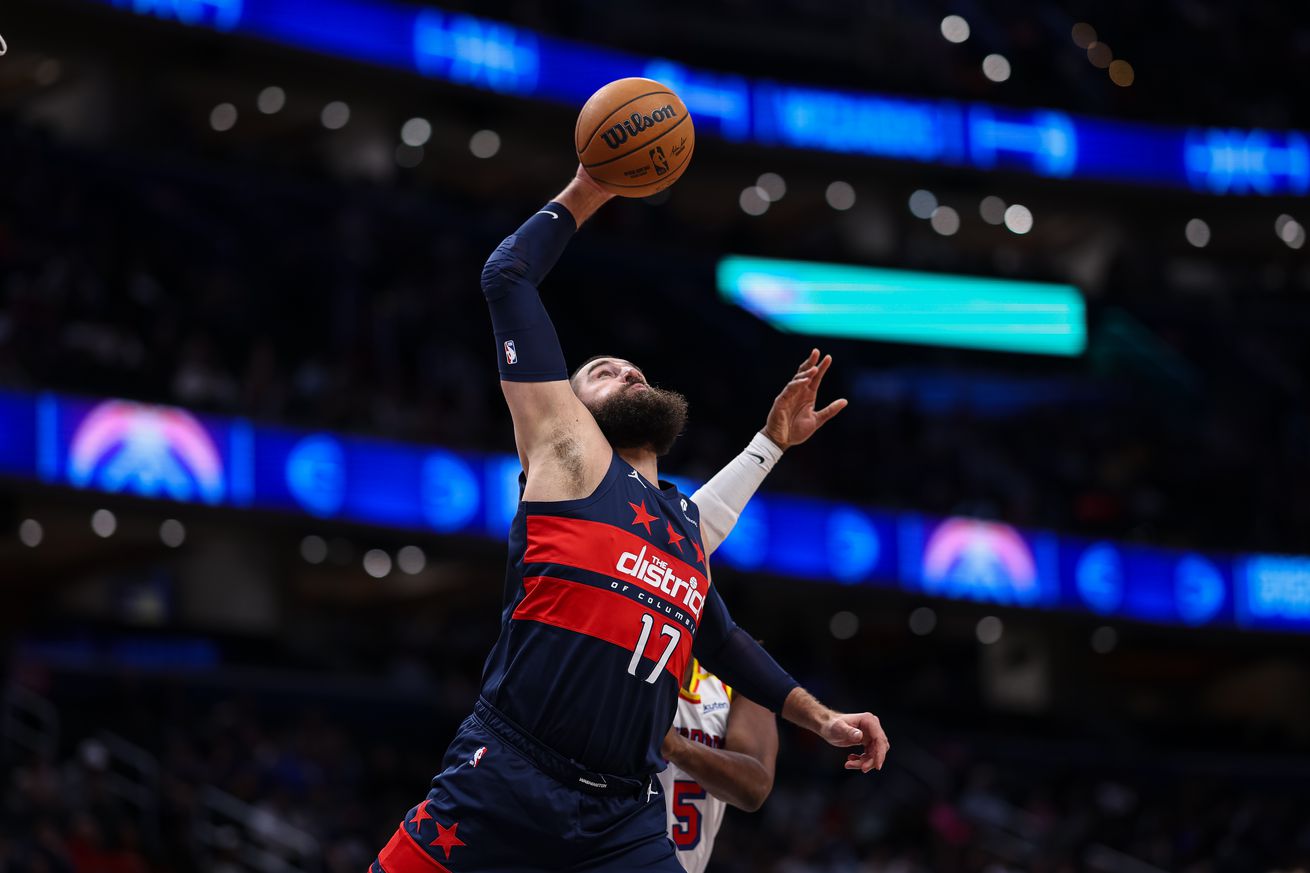
- Jonas Valanciunas was entertaining and effective on offense with 16 points on 6-10 shooting, 12 rebounds, and 7 assists in just 21 minutes. As for his defense, I’ll note that his lack of agility hurts the team defense. A lot.
- The Wizards committed just nine turnovers in a game with 102 possessions. The only player with more than one turnover was Coulibaly (who had three).
The Wizards have three days off before beginning a five-game road trip against the Memphis Grizzlies.
Four Factors
Below are the four factors that decide wins and losses in basketball — shooting (efg), rebounding (offensive rebounds), ball handling (turnovers), fouling (free throws made).
Stats & Metrics
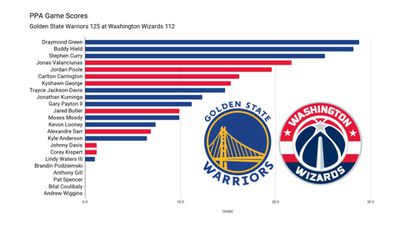
Below are a few performance metrics, including the Player Production Average (PPA) Game Score. PPA is my overall production metric, which credits players for things they do that help a team win (scoring, rebounding, playmaking, defending) and dings them for things that hurt (missed shots, turnovers, bad defense, fouls).
Game Score (GmSC) converts individual production into points on the scoreboard. The scale is the same as points and reflects each player’s total contributions for the game. The lowest possible GmSC is zero.
PPA is a per possession metric designed for larger data sets. In small sample sizes, the numbers can get weird. In PPA, 100 is average, higher is better and replacement level is 45. For a single game, replacement level isn’t much use, and I reiterate the caution about small samples sometimes producing weird results.
POSS is the number of possessions each player was on the floor in this game.
ORTG = offensive rating, which is points produced per individual possessions x 100. League average last season was 114.8. Points produced is not the same as points scored. It includes the value of assists and offensive rebounds, as well as sharing credit when receiving an assist.
USG = offensive usage rate. Average is 20%.
ORTG and USG are versions of stats created by former Wizards assistant coach Dean Oliver and modified by me. ORTG is an efficiency measure that accounts for the value of shooting, offensive rebounds, assists and turnovers. USG includes shooting from the floor and free throw line, offensive rebounds, assists and turnovers.
+PTS = “Plus Points” is a measure of the points gained or lost by each player based on their efficiency in this game compared to league average efficiency on the same number of possessions. A player with an offensive rating (points produced per possession x 100) of 100 who uses 20 possessions would produce 20 points. If the league average efficiency is 114, the league — on average — would produced 22.8 points in the same 20 possessions. So, the player in this hypothetical would have a +PTS score of -2.8.
