Oops! That should read finishing, not finished…
The Alex Ovechkin Era in Washington has been typified by goals. A lot of them. More than expected, even. More than expected, literally. To wit, here’s how they’ve fared with respect to actual goals (G) versus expected goals (xG) for each season for which data is available in three different xG models, normalized to an 82-game schedule:
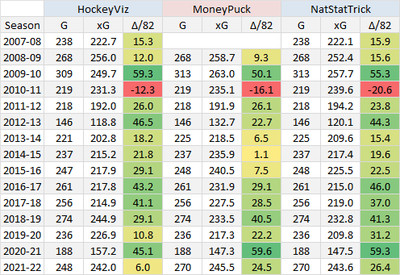
Data via HockeyViz, MoneyPuck and NatStatTrick
You can chalk up the intra-season discrepancies here to the differences among the models, but the theme here is incredibly clear (with one glaring exception, the kind of season that often gets a good coach fired, whether he deserves it or not): the Washington Capitals consistently and often massively outperform their expected offensive production.
Well, they did until this year, at least.
It’s not nearly as bad as it was in 2010-11 – the average of the three models has the Caps at minus-five goals over 82 games, which amounts to just under two points (one win) in the standings. But it’s noteworthy for a team that has put up “better double-check that because that’s wild” positive numbers in the recent past.
So what’s going on? Let’s start with who isn’t the problem by looking at the Caps’ “finishing” heat map:
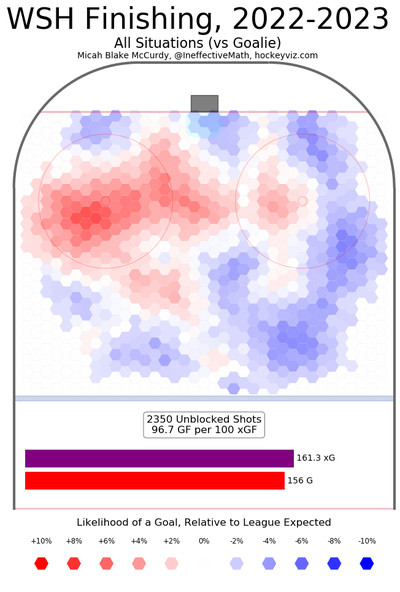
via HockeyViz
Yep, shots from that left-wing circle are more likely to result in goals for the Caps than for the rest of the League – aloha and welcome to Ovechkin Island:
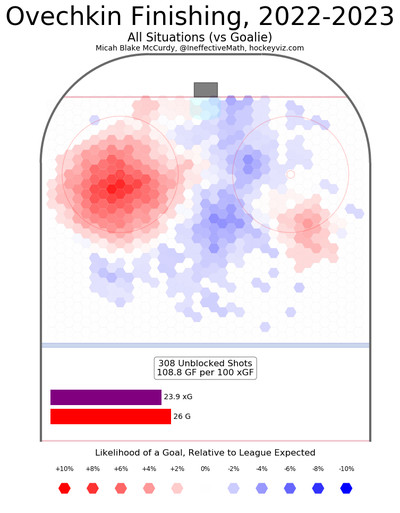
via HockeyViz
The greatest goal-scorer of all-time’s propensity for, well, scoring goals is a huge reason the Caps have routinely beaten their xG because for most players, shots from Ovi’s Office aren’t particularly dangerous; for Alex Ovechkin, they’re layups. By contrast, when other dudes shoot from there, it tends not to go as well:
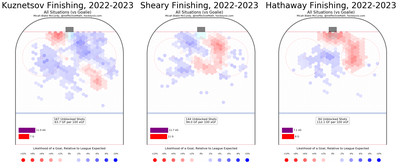
via HockeyViz
That’s not to single out these three (and the volume of shots from that area for the three is relatively low), rather to show how Ovechkin’s volume and success from a not-typically-dangerous area of the ice impacts the team’s actual versus expected goal totals.
But if Ovi is still doing Ovi things from Ovi places, what’s with the downturn?
Let’s do a thought experiment. How does a team underperform its expected goals?
The first way that immediately comes to mind is holding the shots constant and lowering the shooting percentage – you expect ten goals on 100 shots in Year 1 and score ten; you expect ten goals on 100 shots in Year 2 and score nine. That’s a minus-1 actual vs. expected goals, via a drop in shooting percentage.
The second way is holding the shooting percentage constant and increasing the shot quality – you expect ten goals on 100 shots in Year 1 and score ten; you expect 11 goals on 100 shots in Year 2 and score ten. That’s also a minus-1 actual vs. expected goals, via an increase in shot quality.
For the Caps, they’ve seen both happen so far this year. Looking at the last three seasons (recall drops from massively overperforming xG to overperforming xG to underperforming xG), here’s a look at shot rate (SF/60), shooting percentage (SH%), scoring-chance shot rate (SCSF/6), scoring chance shooting percentage (SCSH%), high-danger shot rate (HDSF/60), high-danger shooting percentage (HDSH%), and finally, expected (xGF/60) and actual (GF/60) goal rates:

data via NatStatTrick
Across the board, chances (particularly dangerous ones) have gone up and shooting percentage has gone down. In 2020-21, 51 percent of the Caps’ shots were categorized as scoring chances, and they potted 17 percent of those shots; in 2022-23, 55 percent of their shots have been scoring chances, and they’ve score on just 14.7 percent of them.
Increased expected goals – that’s good!
Decreased actual goals – that’s bad!
Per MoneyPuck, 13 Caps forwards are in the red on goals above expected (i.e. scoring fewer than we’d think), and just four are in the black:
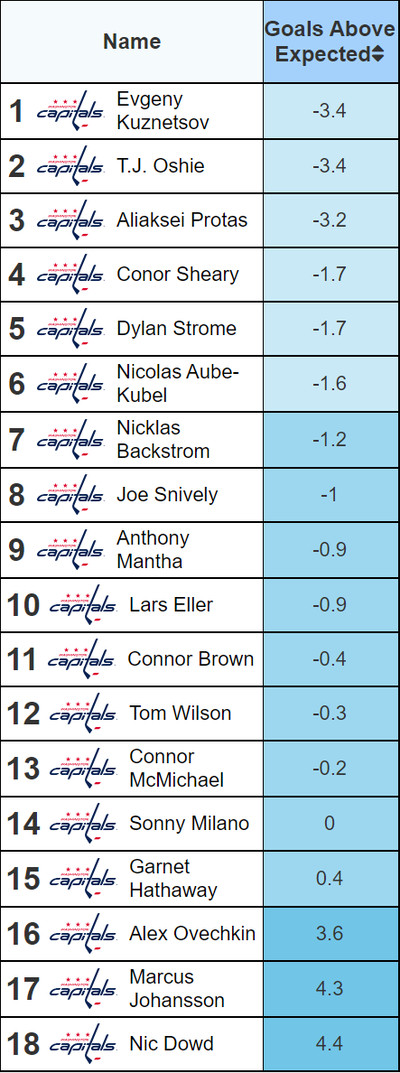
via MoneyPuck
Kuznetsov is shooting just 5.8%, less than half of his career conversion rate prior to this season. Oshie is at 12.7%, nearly five full percentage points off his percentage in his Caps career through last year. Nicklas Backstrom and Tom Wilson have combined to take fewer shots than Matt Irwin has on the campaign. A bounce here, a deflection there and maybe it’s a completely different story.
So is it as simple as sitting back and waiting on positive regression to hit, or is something else going on? Well, in the three years prior to this sample, the Caps’ scoring chance shooting percentage was 15.7, which was actually second-highest in the League (Tampa, 16.8). So there may be a little of that (which, coupled with increased quantity of quality shots, would bode well for the offense).
But let’s think about why the Caps have consistently outperformed expectations in the first place: talent. Specifically, finishing talent. Brilliant scorers like Alex Semin and Mike Green. Depth contributors like Tomas Fleischmann, Troy Brouwer, Joel Ward and Brett Connolly. And, yes, younger, better versions of Ovechkin, Backstrom, Oshie and Kuznetsov.
To put it bluntly, the Caps this season – due to roster construction, injury misfortune and Father Time – have not had the quality of finishers to which Caps fans have grown accustomed. Due respect to Conor Sheary, but he’s not Andre Burakovsky, Matt Irwin isn’t a healthy John Carlson, and Anthony Mantha isn’t Jakub Vrana.
But the Caps have been able to offset that LOFT (Lack Of F’ing Talent) issue by creating more offense for the guys who are here… because 2009’s Sergei Fedorov isn’t walking through that door. A healthy Tom Wilson (15.4 shooting percentage over the last five seasons) and John Carlson (fourth-highest shooting percentage among regular defensemen over the last five seasons) would help too.
The bottom line is the Caps seem to be doing what they can with what they’ve got, and it’s going about as expected… which is unexpected in these parts.
