Statistical clues about what needs to improve
With the Super Bowl out of the way, and the 2025 offseason officially underway, thoughts now turn to what areas need to be the focus of GM Adam Peters’ efforts to consolidate and build on the tremendous gains that were made in the Commanders’ historic first year of the roster “recalibration”.
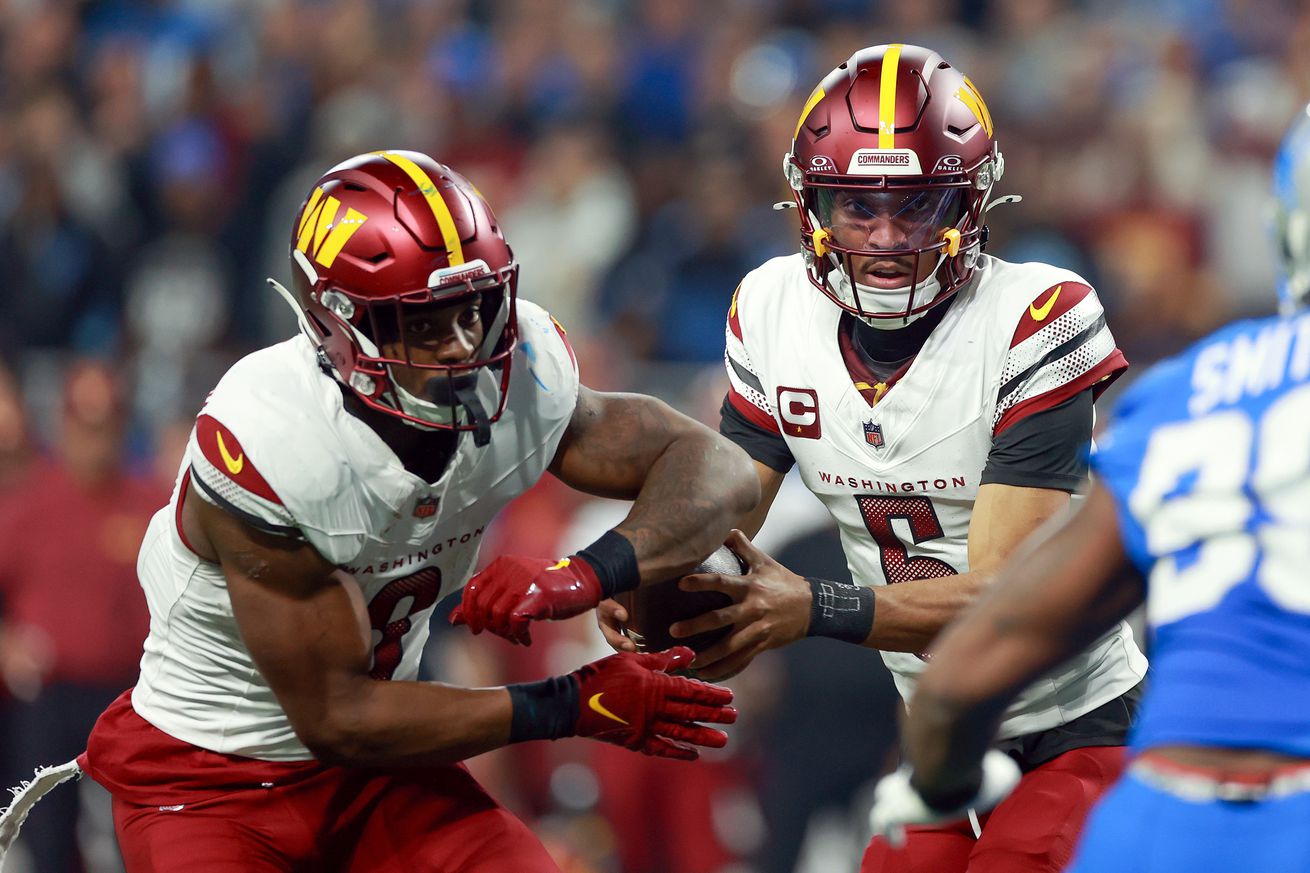
The focus on offense will be building around superstar QB Jayden Daniels to support his continued growth and maximize his already impressive talents. It is said that a potent running game is quarterback’s best friend. On first glance, it would appear that the Commanders have that one covered, as the team ranked 3rd in the league in total rushing yards, 4th in rushing TDs, and 4th in rushing average. They ranked 4th in the league in regular season rush EPA, and tied for 2nd in rushing Success Rate.
However, rather than the running game helping to ease the QB’s load, it could be argued that it was more the other way around. Jayden Daniels was the team’s leading rusher, accounting for 891 (34%) of the team’s 2,619 rushing yards in the regular season. Taking QB rushing stats out of the equation, this is how the Commanders’ other runners compared to the rest of the league in terms of rushing average (Y/A):
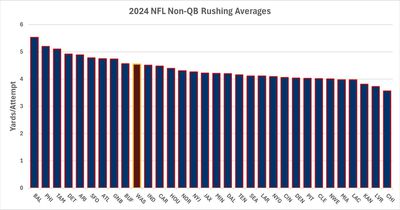
Removing Jayden’s and Marcus Mariota’s rushing stats drops the Commanders from 4th to 10th place compared to the rest of the league’s non-QB rushing attacks. While that is a fair drop, Washington remains in the top third of the league. So you might think that fixing the rushing attack wouldn’t rank highly in the list of offseason priorities.
Of course, that is just based on season average figures. A slightly deeper look into how the season unfolded reveals some weaknesses in the Commanders’ rushing attack, outside of the QB position.
The Commanders’ running backs got off to a good start to the season, averaging over 4.5 Y/A in 5 of the first 8 games, with very strong games against the Giants (Week 2, 6.84 Y/A), Cardinals (5.65 Y/A), Browns (6.24 Y/A) and Panthers (5.65 Y/A). Things started to fall off for the running backs around midseason. From the Week 9 Giants game, the RBs only averaged more than 4.5 Y/A twice, in the Week 13 Titans game (6.47 Y/A) and the Divisional playoff game against the Lions (5.28 Y/A). In the final 12 games of the season, the RBs averaged below 4 Y/A 9 times, with sub-3 Y/A games against the Steelers (2.89 Y/A), Saints (2.96 Y/A), Eagles (Week 16, 2.13 Y/A; NFC Championship 2.68 Y/A), and Buccaneers (Wild Card playoff, 2.32 Y/A).
So, the RBs’ season average of 4.54 Y/A is buoyed by 6 games in which the Commanders ran up big rushing totals against mostly weak defenses, and obscures the fact that they had several weak performances, not all of which came at the hands of strong offenses (e.g. 3.33 Y/A v 30th ranked Cowboys Wk 18, 2.96 Y/A vs 31st ranked Saints).
A simple explanation for the variability in rushing performance is therefore that the Commanders’ RBs ran well against weak rushing defenses and struggled against better defenses. There obvious truth in that. Across the whole season, there was a 0.45 correlation between the Commanders’ game-to-game Non-QB rushing average and strength of opposing rushing defense, measured by opponents’ rushing average.
A correlation of 0.45 means that strength of opposing defense can explain 20% of the variance in the rushing performance. In an attempt to gain insight into what other factors might be at play, let’s have a look at the most likely suspects: run blocking and running backs.
Photo by Greg Fiume/Getty Images

Photo by Greg Fiume/Getty Images
Is it the run blocking?
Over the past year or so, I have been struggling to find a satisfying metric to quantify run blocking. An ideal metric would allow us to separate the contribution of run blockers from the running backs in avoiding defenders. I have come to realize that this is a fool’s errand, because rushing and run blocking performance are inextricably interlinked. So, rather than trying to find an ideal metric, I’ve decided to settle on metrics that are best fit for purpose.
Essentially, we are trying to diagnose the issues with the run game. In the medical field, where I work, we talk about different types of validity of diagnostic tests:
Construct Validity refers to how closely the test is based on what we actually want to measure, rather than something that we think should correlate with what we want to measure. Metrics based on subjective criteria, such as PFF player grades, have questionable construct validity. It is not clear how well run blocking grades actually relate to keeping the runners clean.
Face Validity is more commonly known as the eye test. Do the results seem to make sense? Sports Info Solution’s Blown Block Rate stat failed the face validity test when I discovered that it ranked two-time All Pro OT Penei Sewell as the 23rd best starting RT at run blocking in 2023. Similarly, ESPN’s Run Block Win Rate ranks the 2024 Commanders as the second best run blocking team in the NFL. That just doesn’t seem to match what I saw when I watched games this season.
A run blocking metric that is gaining increasing use is rushers’ Yardage Before Contact. Yardage Before Contact (YBC) has construct validity, because it is outcome-based. It suffers from the limitation that it doesn’t cleanly separate blocking performance from rushing performance, but what does? It seems safe to assume that blocking is the major influence, particularly if we average across all of a team’s rushers. So, as long as we remain mindful of the limitations, it should provide some insight into run blocking performance.
My new tweak is to remove QB data from the rushing stats. My rationale is that rushing by QBs can be fundamentally different from that by running backs. Scrambling QBs run out of passing sets, when defenders have vacated the box in coverage, and pass rushers have moved into the backfield, taking the blockers with them. This is a major reason why running QBs are so effective, but it also uncouples their rushing success from run blocking by the OL. In 2024, Jayden Daniels ran for 4.4 Yards Before Contact, which was 0.6 yds better than any RB with a minimum of 100 rushing attempts. Therefore, running QBs inflate team YBC figures, making them less representative of run blocking performance. Most importantly, this effect is likely to be strongest in the few teams like the Commanders with highly effective running QBs.
Here is how the Commanders compared to the rest of the league in Non-QB Yards Before Contact per Rush Attempt (YBC/Att):
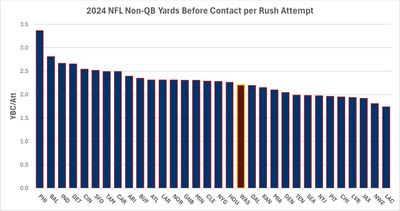
Overall, this method of ranking run blocking passes some basic sanity checks. Well regarded units like the Eagles, Ravens and Lions are near the top of the rankings, teams with poorly regard OLs, like the Patriots, Titans and Seahawks are near the bottom.
The Commanders’ Non-QB rushers, predominantly RBs, averaged 2.21 YBC/Att throughout the regular season, which ranked 19th overall. This places the Commanders toward the tail end of the middle pack in run blocking. That seems to make more sense than 2nd overall.
It also makes sense that a mediocre to below-average run blocking team would struggle to get the rushing offense against stronger defenses and have good days against weaker defenses.
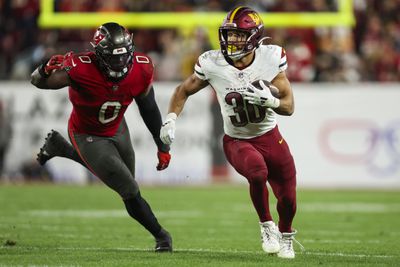
Photo by Perry Knotts/Getty Images
Was it the running backs?
Brian Robinson Jr was the Commanders’ lead back and accounted for 52% of Non-QB rushing attempts (187 att), and 62% of rushing yards (799 yds) in the regular season. Robinson’s 4.27 Y/A rushing average ranked 20th among 32 NFL lead backs.
BRob frequently found himself having to battle for yards and was one of 11 lead backs who gained more yards after contact (421 yds) than before contact (378 yds). Robinson ranked 11th among lead backs in Yards After Contact per Attempt (2.25 YAC/Att) despite not being particularly adept at breaking tackles (18.7 Att/Broken Tackle, rank 21/32).
Success Rate can provide a fairer assessment of rushing performance than yardage for RBs with a lot of runs between the tackles and short yardage. Robinson’s 48.7% rushing Success Rate ranked 19th among lead backs and 36/70 RBs with a minimum of 50 rushing attempts.
Robinson was close to average among lead backs in terms of ball security. He fumbled twice in 187 regular season rushing attempts. His 1.07% fumble rate was the 14th highest among lead backs.
Robinson made modest contributions in the passing game. He was 8th on the team in receiving yards, catching 20/25 targets for 159 yds. He ranked 42/54 in receiving yards/game among RBs with a minimum of 20 targets and 33/54 in receiving Success Rate.
Austin Ekeler was the change of pace back for much of the season and started 3 games when Robinson was injured. He also added a spark to the kick return game, earning him an AP-2 nomination.
Ekeler contributed 21% of Non-QB rush attempts and 22% of rushing yardage. Ekeler’s 4.8 Y/A rushing average tied with Bijan Robinson and Chuba Hubbard for 11th among 70 RBs with a minimum of 50 rush attempts. He was a more effective rusher overall (51.9% Success Rate, rank 20/70 RB, in 50 att) than Robinson, albeit in a different role.
Ekeler is a smaller back, and was not as good as Robinson at breaking tackles (25.7 Att/BrTkl, rank 53/70) or gaining yards after contact (1.8 YAC/Att, rank 45/70).
Ekeler was the Commanders’ 5th leading receiver during the regular season in terms of total yardage (366 yds), and 4th on the team in Yards/Game (30.5). He ranked 3rd in receiving Y/G among 54 NFL RBs (min 20 tgts), and 14th in receiving Success Rate.
Jeremy McNichols spelled BRob in games and filled in for him when he missed games with injuries. He also contributed on special teams.
For an unsung journeyman, McNichols was surprisingly effective with the ball in his hands. He had 55 carries for 261 yds (4.75 Y/A), 15 first downs, and 4 TDs in the regular season, with no fumbles.
His 58.2% regular season rushing Success Rate ranked 8th best among 91 running backs with a minimum of 30 rush attempts. His 4.75 Y/A rushing average ranked 22nd.
McNichols was the best Commander RB at breaking tackles, averaging just 7.9 rush attempts per broken tackle (rank 10th/91 RBs). He was also very good at gaining yardage after contact at 3.0 YAC/att (rank 4th/91 RBs).
Chris Rodriguez started the season on the practice squad, and was elevated to the active roster in Week 9 when BRob was injured. He played sparingly in 6 regular season games and made good use of his opportunities when he got them.
CRod only had 35 rushing attempts in 6 games, with 69% of his carries in just two games, including the Tennessee game, in which the Commanders’ OL dominated the defense. So we need to be cautious about making too much of a small sample. But he was excellent when he got opportunities.
CRod’s 74.3% Rushing Success Rate was the highest among 91 NFL RBs with a minimum of 30 attempts. The next closest player was Buffalo’s Ty Johnson at 65.9%. His 4.9 Y/A rushing average ranked 14th out of 91 backs. He did not fumble this season.
One of Rodriguez’s strengths as a runner is contact balance. He is unusual in that he gained nearly twice as much yardage after contact (111 yds) than before contact (62 yds). His 3.2 YAC/att average was 3rd highest out of 91 RBs.
Running Backs Summary
The Commanders’ lead back, Brian Robinson, got the majority of Non-QB rush attempts. His performance ranks as a little below average among lead backs. Austin Ekeler proved to be a capable change of pace back, and was effective on outside runs and as a receiver. But he lacked the size and strength to be effective between the tackles. The backup RBs, Jeremy McNichols and Chris Rodriguez proved to be unexpectedly effective at picking up the hard yards when called upon in a limited capacity.
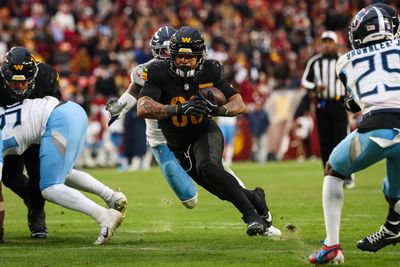
Photo by Scott Taetsch/Getty Images
Rushing Performance and Yardage Before Contact
So far we’ve seen that the Commanders’ run blocking, as reflected by yardage before contact, was fairly mediocre throughout the season as a whole. The lead back’s rushing performance was also a little below league average, while the supporting cast at RB was somewhat more effective.
Now, to pull it all together, let’s have a look at how Non-QB rushing performance related to yardage before contact throughout the 2024 season. For this illustration. We need a different rushing metric, since Yards Before Contact is a component of rushing yardage, and is therefore expected to be correlated with Yards/Attempt. To get at least one step removed from yardage based metrics I chose Rushing Success Rate. Success Rate is related to rushing yardage, but it takes other factors into account as well.
Rushing Success Rate is the percentage of rushing attempts achieve a success for the offense. What constitutes a success depends on down and distance. A successful run achieves 40% of the yards to gain on first down, 60% on second down, and either converts or scores on third and fourth downs.
The following graph illustrates how Non-QB yardage before contact and rushing success varied throughout the season:
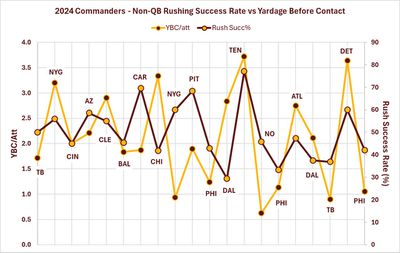
The first thing that stands out is that yardage before contact and rushing success both varied considerably from game to game throughout the season. Unexpectedly, both variables seem to vary in a nearly cyclical manner. I am not sure what that could mean.
The second thing to draw your attention to is that, during parts of the season, there was a strong tendency for the two to vary together. From Week 1 through the Week 6 Ravens game, and again from the Week 13 Titans game through the end of the season, there was an obvious tendency for Rushing Success Rate and YBC/att to rise and fall together.
From Weeks 7 through 12, yardage before contact and rushing success kind of went their separate ways. That is very puzzling. And again, it’s not clear what it means.
Without attempting to micro-dissect the different parts of the season, the main takeaway from this graph is that the ability of the RBs to get off the line cleanly varied enormously throughout the season. In games when they got hit close to the line, rushing success suffered, and in games when they had clear runways they piled up big rushing yardage.
This suggests that the Commanders’ rushing performance was limited by run blocking throughout the beginning and end of the season. But it doesn’t prove it. I have no idea what was going on from Week 7 through Week 12.
What about injuries?
No analysis of variation in run blocking and rushing performance would be complete without looking at injuries through the season. Each of the Commanders’ OL starters except Nick Allegretti missed at least one game to injury this season, as did the two main RBs. While there were a few cases where missing a starter was associated with a dip or rise in performance, there was no overall pattern that could explain the variability in blocking or rushing performance
OL Injuries: The most anomalous dip in rushing performance of the season, against the Saints, occurred in the first game that C Tyler Biadasz missed with injury. But the Commanders had decent YBC figures when he missed time in the final two games of the regular season. The Commanders’ had very good to exceptional YBC figures in three games that Andrew Wylie missed (Wk 12 DAL, Wk 13 TEN, Wk 16 ATL), suggesting there might be some addition by subtraction. But they had low YBC/att against the Steelers without Wylie in the lineup. The latter was one of the games with a huge mismatch between yardage before contact and rushing success. The Commanders had a very good rushing game in the Divisional playoff game, despite Sam Cosmi missing 45 snaps, followed by a dismal game without him the following week. Similarly, they had a strong rushing performance against Chicago when Brandon Coleman was out with injury, and decent YBC but poor rushing performance in the first Dallas game in which he was injured. Overall, I couldn’t see any clear pattern.
RB injuries: Brian Robinson missed the Ravens game, which was one of the weaker Non-QB rushing performances of the season. But he also missed the Week 9 Giants and Week 10 Steelers’ games, when the RBs achieved Success Rates of 60% and 68.4%, respectively. Similarly, when Austin Ekeler was out with injury, the Commanders had strong rushing performances against the Cardinals and Titans, and weak performances after the bye against the Saints, Eagles and Falcons. The other RBs likely did not play enough to swing the needle. So, once again, there was no clear relationship between RB injuries and rushing performance that could explain the variability in Commanders’ ground game throughout the season.
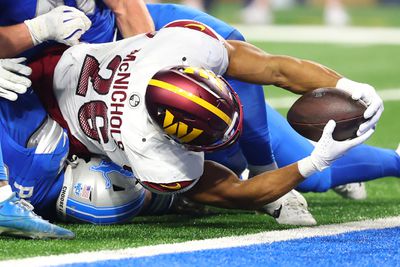
Photo by Gregory Shamus/Getty Images
TL:DR
For Hogs Haven readers on the go, the key takeaways are:
- While the Commanders had very good overall rushing numbers, the season stats were inflated by the contribution of an exceptional rushing QB.
- Taking QBs out of the equation drops the Commanders’ run ranking from top 4 to 10th overall.
- While that doesn’t seem too bad, the season averages conceal the fact that rushing performance by RBs was highly variable throughout the season, with poor performances predominating later in the season.
- I tried out a new outcomes-based metric of run blocking performance, YBC/Att by Non-QBs, by which the Commanders ranked 19th in the league.
- RB Brian Robinson rates a little below average by most rushing metrics among lead NFL backs. The other running backs were more effective rushers in different roles.
- On a game by game basis, run blocking, as reflected in yardage before contact was highly variable. Rushing performance covaried with RBs’ YBC throughout most of the season, suggesting that it may have been limited by run blocking.
- The OL and RB corps were both impacted by injuries throughout the season. However, injuries to starters do not appear to explain the massive variability in rushing and run blocking performance throughout the season.