Part 2 of the dive into what made Washington’s run game tick last season
My previous article on the Commanders’ running game revealed that the ability of the running backs to get off the line cleanly varied considerably throughout the season and overall rushing performance varied with it.
Those findings might suggest that rushing performance was limited by run blocking. But it’s equally possible that the Commanders’ RBs simply failed to make more than was given to them. And those two possibilities are not mutually exclusive. It is challenging to tease things apart analytically, because rushing and run blocking performance are not entirely separable.
Nevertheless, I thought it would be worth having a stab at seeing whether the metrics I used in the previous article can shed any light on whether the run blocking or the running backs were the limiting factors in Washington’s on-again, off-again rushing attack last season.
In the first article, I used team-level non-QB Yardage Before Contact as an outcomes-based metric for run blocking performance, and Rushing Success Rate to measure rushing performance. The rationale and analytical details are explained in that piece.
The main innovation was taking QB yardage out of the rushing stats. The reason for doing so is that the relationship between rushing and run blocking is fundamentally different for running QBs, like Jayden Daniels, and running backs. Daniels was so successful running the ball that his numbers skew the season statistics and obscure what was going on with the RBs. Removing rushing yards from the equation was the only way to get a clear view of the RBs’ performance.
NFL Lead Back Rushing Success vs Run Blocking
The following graph plots Rushing Success Rate against team-level non-QB Yards Before Contact per Rush Attempt (YBC/att) for every NFL lead back in 2024. The “lead back” is the RB on each team with the most regular season rushing attempts. Most teams had a clearly defined lead back, such as Washington’s Brian Robinson. A few teams ran RB by committee or had an injury to the usual lead back. Regardless of the particulars, I went with the RB with the most carries. Washington’s RBs 2 through 4 are also included to see how they measured up.
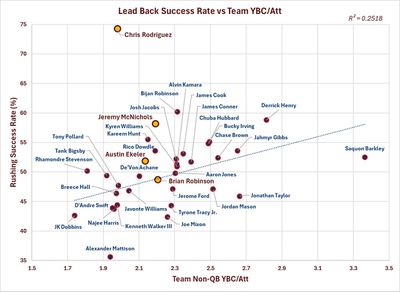
There was a moderate level of correlation between Rushing Success Rate and team non-QB YBC/Att (r =0.50). There is a clear trend to the data, but there is also a great deal of scatter around the trend line. Overall, team-level yardage before contact, as a metric of run blocking, can explain around 25% of the variance in lead back rushing performance. That suggests that other factors are also at play. The most obvious of those is variation in running ability.
The trend line can be considered to indicate the expected rushing success for a given level of blocking performance. Running backs who create opportunities through superior vision, burst, or ability to run through contact, should sit above the trend line. Those who just take what the blocking gives them would be expected to sit on the trend line. And those who don’t perform up to the level of their run blocking should fall below the line.
The biggest positive outlier among lead backs was the Atlanta Falcons’ Bijan Robinson, who achieved a Rushing Success Rate more than 10% higher than expected based on the Falcons’ run blocking. The worst performing lead back was the Raiders’ Alexander Mattison, who had the most carries in a lackluster rotation with Ameer Abdullah and Zamir White in a highly pass-oriented offense.
You might notice NFL Offensive Player of the Year Saquon Barkley, sitting along on the right side of the plot, and well below the expectation, based on the Eagles’ league-leading YBC figure. Saquon’s statistically freakish season created something of an anomaly with regard to the Rushing Success Rate statistic. A comparatively high proportion of his total yardage came from a relatively small number of highly explosive plays. Saquon was a close second to Derrick Henry in number of running plays over 20 yds (Henry 19, Barkley 17), and led the league with 6 runs over 50 yds. Runs over 20 yds accounted for 34% of his regular season yardage total. But compared to backs with higher Rushing Success Rates, such as Henry, Bijan Robinson and the Chiefs’ Kareem Hunt, he had a slightly lower proportion chain moving runs. Averaging one game-breaking play per outing was good for first team All-Pro and OPoY honors, but it resulted in slightly lower Rushing Success Rate than you would expect based on his other rushing stats and the Eagles’ team YBC. So, in Saquon’s case, I don’t think that sitting below the trend line means that he underperformed relative to his blocking. Rather his unique distribution of rushing gains result in the Success Rate statistic under-reporting his rushing efficiency.
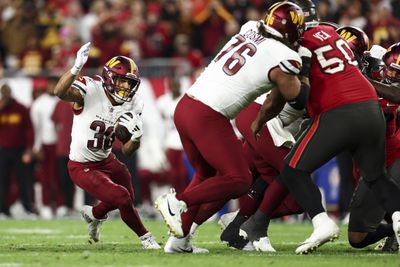
Photo by Kevin Sabitus/Getty Images
Commanders’ RBs
Now, back to the Commanders. As we saw in the preceding article, Washington’s run blocking, as indicated by non-QB YBC/att, ranked 19th overall, placing the Commanders toward the bottom end of the middle third of the league in run blocking.
Brian Robinson
Not coincidentally, BRob’s Rushing Success Rate of 48.7% also ranked 19th among NFL lead backs. It was exactly what you would expect based on the Commanders’ run blocking. That might suggest that BRob was able to take what the blocking gave him, but he was not able to create his own opportunities consistently when the blockers didn’t open lanes for him.
In Robinson’s case, I used the Commanders’ regular season non-QB YBC/att figure to keep his data consistent with that of the other lead backs. The other RBs played fewer games, so I calculated their team YBC stats from just the games they played in. This makes the data more representative of the run blocking they played behind. As it turned out, there wasn’t enough variation in the YBC figures for the four backs to affect any of the conclusions.
Austin Ekeler
Ekeler’s Rushing Success Rate was a little higher than Robinson’s at 51.9%. That put his data point a little above the trend line. Given the margin of error with this kind of data, his rushing success was probably right within the range of expectations based on the team YBC figure.
Jeremy McNichols
McNichols finds himself in very good company in this graph, right Kareem Hunt and Bijan Robinson.
There are more or less two ways for an RB to create rushing gains beyond what the blocking gives them. They can be elusive, to avoid contact, or they can be good at breaking tackles and running through contact. McNichols’ neighbor, Bijan Robinson did a bit of both. He had the 14th highest missed tackle rate among lead backs (13.2 Att/Broken Tackle) and had the 11th highest Elusiveness rating (73.0 PFF Signature Stat) among the 32 RBs with the most carries.
McNichols earned his rushing gains the hard way. His broken tackle rate of 7.9 Rush Att/Broken Tackle was the highest on the team and the 10th highest among 91 RBs with a minimum of 30 rush attempts. His 3.0 average Yardage After Contact (YAC/att) figure was also exceptional, ranking 4th among 91 RBs. At just $1.125 million APY, he might be worth keeping around for another year as a rotational back and short yardage specialist.
Chris Rodriguez
And that brings us to the burgundy and gold data point at the very top of the graph. Rodriguez only had 35 carries during the season. When he did get the ball, he made the most of his opportunities.
Not only were his carries a small sample, 24 of them (64%) were in just two games. So, there is an obvious question about how representative his rushing stats were, and whether he could sustain that level of rushing success across a whole season.
Nevertheless 11 of CRod’s carries were in the Week 9 game against the New York Giants. As a group, the RBs averaged just 0.93 YBC/Att, making it the third worst run blocking performance of the season. Rodriguez averaged 1.0 YBC/Att in that game, so he wasn’t getting much more help from the blocking than his peers. He picked up 41 of his 52 rushing yards after contact (avg 3.7 YAC/att) along the way to achieving a Rushing Success Rate of 72.7%.
His other big game was against the Tennessee Titans, when the OL had their best day outing of the season (non-QB YBC/att = 3.7 yds). Rodriguez averaged 3.3 YBC/att on 13 carrries in that game, and had a Rushing Success Rate of 92.3%
For the season, CRod ran 35 times for 173 yds (4.94 Y/A), 10 first downs and 2 TDs. That equates to a first down or touchdown on 34.3% of carries. So it is not hard to see how he achieved a league-leading 74.3% Rushing Success Rate. Amazingly, 111 of his 173 rushing yards (64%) were gained after contact. His average of 3.2 YAC/att was the third highest out of 91 RBs with a minimum of 30 carries.
While it is just a small sample, Rodriguez created the majority of his yardage by running through contact. His performance well exceeded expectations of the blocking in front of him.
There must be a reason that the coaching staff chose to roll with Brian Robinson as the lead back, and leave CRod on the practice squad for most of the season. Nevertheless, his exceptional performance in limited opportunities would seem to warrant bringing him back to compete for a roster spot in camp.
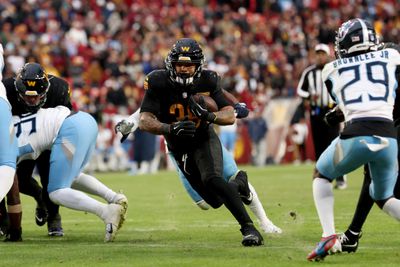
Photo by Scott Taetsch/Getty Images
Conclusion
The Commanders had the third or fourth best rushing attack in 2024, by various rushing statistics. But much of that was due to Jayden Daniels. Removing QB stats, the rushing attack ranked 10th in the league. There was a huge amount of game to game variability in the rushing attack, and a lot of the rushing yardage came in few games, generally against weaker teams. If the Commanders are going to compete with teams like the Philadelphia Eagles and Detroit Lions consistently, they will have to up their game.
The question is whether they need to focus on the RB position, OL, or both.
The previous article showed that the Commanders’ run blocking, measured by Non-QB YBC/att, ranked 19th in the league. Furthermore, the team’s rushing success varied in synch with the run blocking for much of the season. Those observations seem to point to the OL as an area for improvement. However, much of the variability in the rushing game was not explained by the run blocking.
This article had a look at whether any of the Commanders’ RBs were able to create their own opportunities. The results suggest that the primary backs, Brian Robinson and Austin Ekeler, seem to take what the blockers give them. But neither appeared to create much additional yardage on a regular basis.
The backup RBs, Jeremy McNichols and Chris Rodriguez were both better at gaining yardage after contact. While neither of these players seems likely to earn a feature back role, they can provide value as rotational players and in short yardage situations. In just 35 carries, Rodriguez flashed potential do more in an expanded role.
As the Commanders look to build offensive capabilities around Jayden Daniels, there is plenty of room for improvement at running back, in addition to bolstering the offensive line.