Part 3 of the search for clues about areas to build this offseason
The headline statistics indicate that the Washington Commanders had a top four running game in 2024. The team ranked third in the league in regular season rushing yards (2,619 yds) and fourth in rushing TDs (25) and yards per attempt (5.0 Y/A). However, accumulating statistics across an entire team and season can hide some ugly bumps and wrinkles.
If we take the QB rushing stats out of the equation, the Commanders drop to 10th in the league in Y/A. Even then, the RB rushing stats are propped up by a few big games against weak rushing defenses. Against teams with top 10 rushing defenses (Buccaneers, Ravens, Steelers, Eagles), the Commanders’ running backs averaged just 2.8 Y/A, a significant drop from their 4.14 Y/A season average.
If the goal is to finish in the top 10 of the league, the RB rushing attack might be adequate. However, if the Commanders aim to compete for championships with teams like the Eagles, Broncos, Packers, Steelers and Chiefs, they will have to fortify the RB rushing attack.
This article is the third and final instalment of my dive into the 2024 running game, looking for clues about areas that Adam Peters may look to improve this offseason.
The first article in the series demonstrated that the non-QB rushing attack was highly variable throughout the season. Through the first 6 games, and again in the final 8 games, the running backs’ success seemed to rise and fall from game to game in sync with the run blocking. For 6 games in the middle of the season, spanning the 3-game losing streak, the run game seemed to decouple from the run blocking. These observations suggest that run blocking was a limiting through much of the season, but could not explain all of the struggles.
The second article examined how the Commanders’ individual running backs’ rushing success related to the team’s run blocking. The team’s primary backs, Brian Robinson and Austin Ekeler had Rushing Success Rates that placed them among middle of the pack starters. Neither showed evidence of being able to consistently create opportunities beyond what the blocking gave them. Backups Jeremy McNichols had better than expected success, in limited roles.
Taken together, the findings of the first two articles suggest that there is plenty of room for improvement to RB corps as well as the Commanders’ run blocking.
The final article will focus on the offensive line and attempt to determine which starting offensive linemen held their own on running downs and whether there were any particularly weak areas for Adam Peters to shore up this offseason. I will start by analyzing the rushing success and run blocking at the team-level through the different offensive line gaps. Then I will then attempt to break it down to the level of individual offensive linemen to see if we can identify any weak links in the starting lineup.
Rushing Direction
The analysis in this article relied on Pro Football Focus rushing direction stats. As part of their Premium Stats package, PFF analysts break down the rushing direction of every running play throughout the season by offensive line gap. PFF’s rushing direction terminology is illustrated in the following diagram:
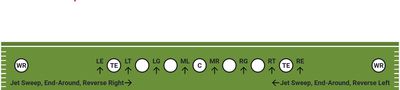
The rush direction data are further broken down by individual rushers, and include yardage and yardage after contact figures. This makes it possible to analyze rushing success through different gaps at the team level, by position group (RB vs QB) and at the level of individual players. Throughout the article, I will refer to PFF’s terminology, as well as the traditional A-gap (between center and guard), B-gap (guard to tackle), C-gap (tackle to TE) terminology, as appropriate.
Team-Level Stats
Where Did the RBs Run the Most?
The following graph shows the distribution of RB rushing attempts by OL gap throughout the 2024 season. Data were compiled for all 20 games in the regular season and playoffs.
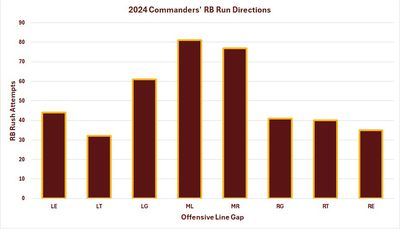
Kliff Kingsbury and Anthony Lynn showed a clear preference for running the backs through the A-gaps on both sides of the center. The next most common choice was the B-gap between left guard and left tackle. Runs through the B-gap between right guard and right tackle, as well as other gaps, were less frequent. The least utilized gap on RB runs was the C-gap, outside the left tackle.
Where Did the RBs Find the Most Success?
Now let’s take a look at RB rushing average by OL gap:
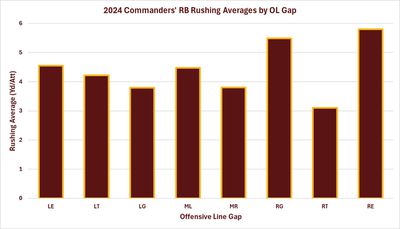
That looks a lot different from the last graph. While the RBs rushed the most through the A-gaps and B-gap between left guard and left tackle, they had the highest average gains rushing through the B-gap between right guard and right tackle, and around the right end.
The highest rushing average was around the right end and the lowest in the C-gap outside the right tackle. The Commanders’ RBs averaged 5.8 Y/A on runs around the right end last season. However, that figure is inflated by a relatively small number of explosive gains by Brian Robinson, including runs of 40, 16 and 10 yds against the Titans, and a 19 yard gain against the Bears. That handful of plays skews the average in the comparatively smaller sample of RE rush attempts.
Where Did the RBs Find the Cleanest Running Lanes?
In this series I have adopted team-level non-QB yardage before contact as an indicator of run blocking. In this analysis, I took it a step further by removing the 6 rushing attempts by WRs from the data. My rationale for choosing this metric is explained in the first article. It’s not perfect by any means, since YBC is influenced by the backs’ abilities to avoid contact as well as the run blocking. Averaging across all the RBs on the team helps to minimize confounding influences of RB elusiveness. And let’s face it, none of Washington’s RBs will be mistaken for Barry Sanders. So, hopefully it is good enough to provide some insight of what is going on in the different OL gaps.
The following graph shows Yardage Before Contact per Rushing Attempt (YBC/Att) by OL gap for the Commanders’ RBs in 2024:
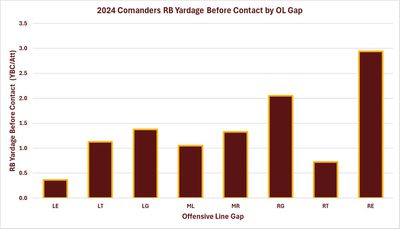
The graph is kind of swamped by the 2.94 YBC/att figure for runs around the right end. As in the previous section, the RE figure is skewed by a handful of breakaway plays by Brian Robinson against the Titans and the Bears, in which he put up huge YBC figures.
Focusing on interior runs, which are most reflective of OL run blocking, the RBs got the furthest before meeting defenders (2.05 YBC/att) on runs through the B-gap between right guard and right tackle, labelled “RG”. They had the toughest going on the interior through the A-gap to the left of center (1.05 YBC/att). Curiously enough, that was the gap most frequently called on RB runs.
There was even a bigger disparity between runs around the left edge (LT, 1.13 YBC/att) and the right edge (RT, 0.73 YBC/att). The right edge was the weakest gap for run blocking along the OL.
Run blocking, as reflected by YBC, seemed to correlate with rushing success at some OL gaps, but not obviously at others. As discussed above, the figures for the RE gap were blown out by a few breakaway runs.
The other two obvious points of agreement between the rushing averages and the YBC figures were on the right side of the line. One was the RG gap (right guard to tackle), which seems to be a strong point for the RB rushing attack in terms of both rushing average and yardage before contact. Curiously, it was not a major focus of rushing play calls. The second was the immediately adjacent RT gap (right tackle to TE), which was the weakest OL gap in terms of both YBC and rushing average.
The team level data seem to point to a correspondence between run blocking and rushing success along parts of the OL. But it is not clear what is going on at the other positions. In an effort to visualize run blocking performance at the level of individual offensive linemen, I undertook a somewhat experimental analysis, which is presented in the final section.
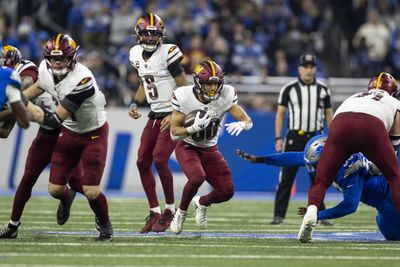
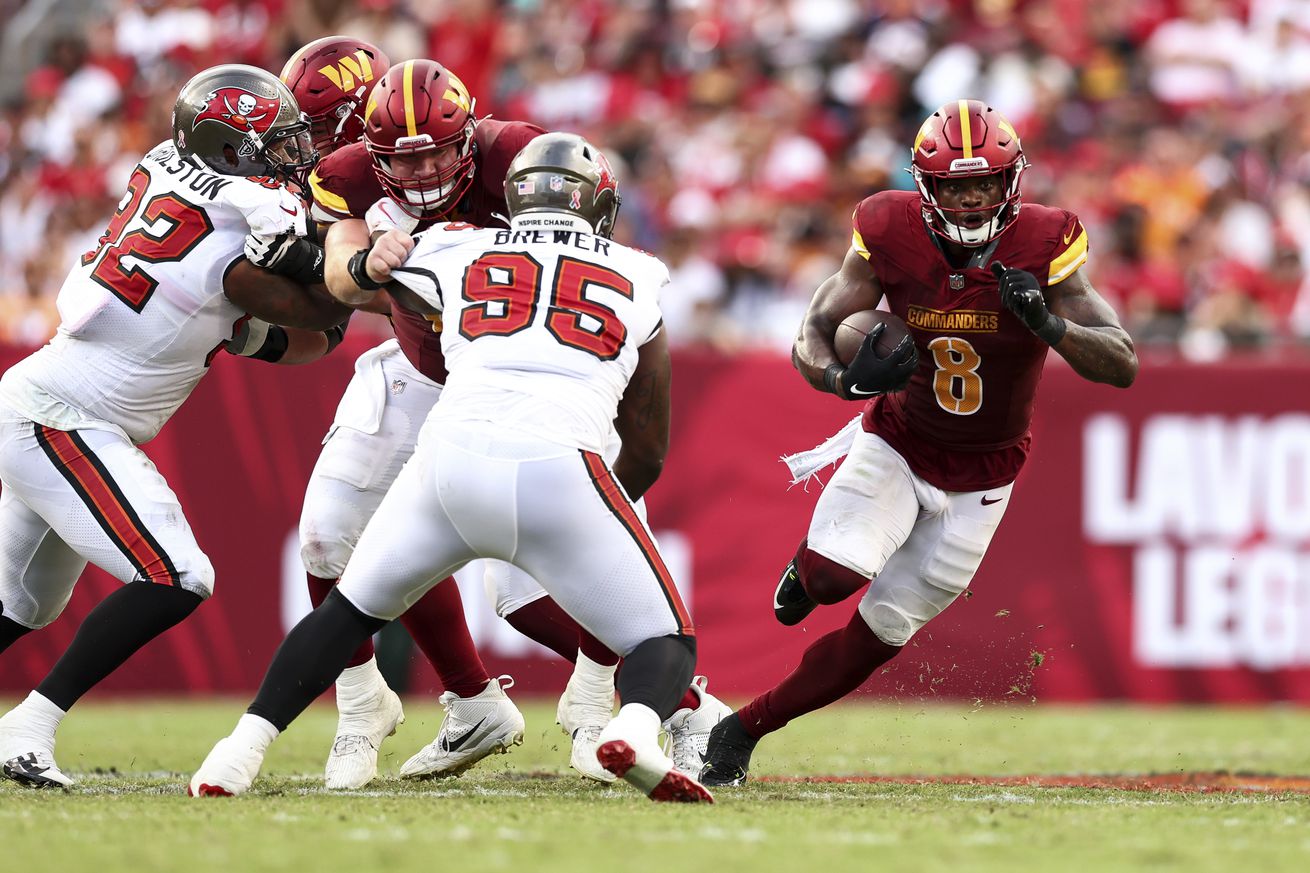
Photo by Michael Owens/Getty Images
Run Blocking Performance by Individual Starters’ Gaps
The idea of this analysis was to compare run blocking performance, as reflected by RB YBC/att, in the gaps manned by each OL starter. For example, LT Brandon Coleman is likely to be involved in blocking on runs through the LT and LG gaps in PFF’s terminology. Sam Cosmi manned the MR and RG gaps, when he was playing.
There is an obvious confound to this simplistic approach. The Commanders’ blocking scheme combines gap and zone blocking concepts, which means there were a lot of pulling blocks. On any given run, the lead blockers might be linemen pulling from the other side of center, rather than the players on either side of the gap when the ball is snapped. Unfortunately, PFF’s data is not broken down by blocking scheme. Nevertheless, the hope is that averaging over 30 to 80 runs through a given gap, and 56 to 142 rushing attempts per lineman, in the course of a season, will allow us to see the contribution of individual players who usually man the gaps, despite pulling blocks.
My approach did correct for the other source of variation which might have obscured individual contributions to the team level stats. Aside from iron man Nick Allegretti, each of the Commanders’ OL starters missed at least one game. Also, Brandon Coleman alternated series with Cornelius Lucas early in the season. To further isolate individual blockers’ performances, I only included data in the analysis from games in which a lineman played a minimum of 80% of blocking snaps.
Excluding partial games did a very good job of preventing contamination of individual player’s stats with blocking reps from other players. But it did reduce the number of games I had to work with for some players and left too little data to say much about the backups. The numbers of games and rushing attempts analyzed for each of the OL starters were as follows:
LT Brandon Coleman (LT & LG gaps): 11 games, 56 rush att
LG Nick Allegretti (LG & ML gaps): 20 games, 142 rush att
C Tyler Biadasz (ML & MR gaps): 16 games, 131 rush att
RG Sam Cosmi (MR & RG gaps): 18 games, 107 rush att
RT Andrew Wylie (RG & RT gaps): 16 games, 64 rush att
The yardage before contact data for the Commanders’ OL starters were as follows:
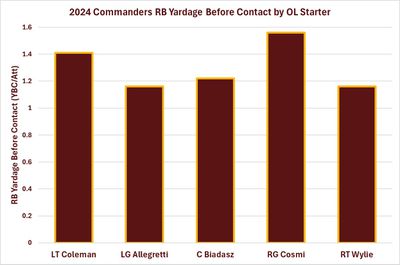
As expected from the team level data, as well as watching games on Sundays, RG Sam Cosmi comes across at the best run blocker on the offensive line by this metric.
Some readers might be surprised to see rookie Brandon Coleman emerge with the second best YBC figures at his gaps. Others might not. His relative ranking as the second best run blocker on the team is supported by independent sources, as we’ll see below.
The other three OL starters appear to be about the same in terms of YBC through their gaps.
How Do These Results Compare to Other Metrics?
I am aware of four other numeric metrics of run blocking:
Sports Info Solutions (SIS) Blown Block Rate – percentage of rushing plays on which a failed block allowed the defender to negatively impact the play
SIS Run Stuff Rate – percentage of plays on which the rusher was stopped behind the line
ESPN Run Block Win Rate – percentage of plays on which a player “wins” the block, determined “using a long list of geometric and kinematic rules designed to identify when a defender becomes a threat to a runner”.
PFF Run Block Grades – analysts mark contribution of blocking on each snap to play success.
Here is how the various metrics rate the Commanders’ run blockers:
All metrics rank Brandon Coleman among the top 3 run blockers on the team. Results for the other OL starters were more varied.
SIS Blown Block Rate: Brandon Coleman was the runaway leader by SIS Blown Block Rate at just 0.7%. Three players (Allegretti, Cosmi, Wylie) formed a second-tier peloton, tied at 2.3%. Biadasz brought up the rear at 3.0%.
SIS Stuff Rate: Nick Allegretti allowed the lowest rate of RB stuffs at just 0.2%. He was followed closely by Coleman at 0.3%. Cosmi was third at 0.7%, with Wylie on his shoulder at 0.9%. Biadasz was in distant last place at 1.9%.
ESPN Run Block Win Rate: ESPN only publishes figures for the top 10 OTs and iOL. Brandon Coleman’s 79% RBWR tied for 6th highest among OTs with the Rams’ RT Rob Havenstein and teammate Cornelius Lucas. Cosmi’s 75% RBWR placed him in a 4-way tie for 5th place among iOL with Trey Smith (Chiefs), Isaac Seumalo (Steelers), Ezra Cleveland (Jaguars), and Wyatt Teller (Browns). None of the Commanders’ other OL cracked the top 10 at their position groups.
PFF Run Blocking Grades: According to PFF grades none of the Commanders’ starters ranked within the top 20 at their positions in terms of run blocking. The highest rated Commander was Sam Cosmi, with a grade of 64.8 (rank 28/64 guards, min 200 run block snaps). Nick Allegretti ranked 33rd with a 62.3 grade. Tyler Biadasz’s 62.9 grade ranked 22nd among 32 centers (min 220 run block snaps). Brandon Coleman ranked 41st among 64 OTs (min 192 run block snaps), while Andrew Wylie ranked 58th. Wylie’s blocking grade of 53.4 was the lowest on the team.
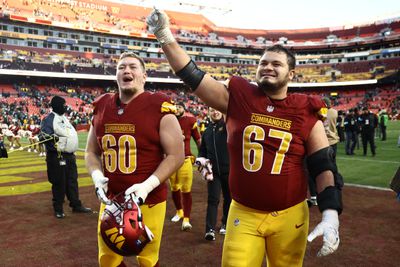
Photo by Timothy Nwachukwu/Getty Images
What About the Backups?
While several of the OL missed some time through the season, there were only four instances in which a backup played more than 80% of snaps at one position in place of an injured starters, as required for this analysis. Michael Deiter played two games at center in place of Tyler Biadasz (Saints, Dallas game 2). And Andrew Wylie was replaced by Trent Scott against the Steelers and by Cornelius Lucas against the Titans.
One or two games is not enough to get a handle on a player’s blocking. However, what these games do allow us to see is what effect replacing a starter, who played most of the season, had on the run blocking.
To address this question, I used a metric called a Z-score which I have used frequently in past articles to give players letter grades. A Z-score measures how far a single sample is from the mean (average) of a population in units of the population’s standard deviation. Z-scores tell us how large the deviation from the population mean is relative to the variability of the population. They are also the basis of grading on bell curve, which older Gen X and boomers might be familiar with. A Z-score of 1 means the sampled point is one standard deviation above the mean, and corresponds to a letter grade of B. The full grading scale is as follows: Z = 2+, A; Z = 1, B; Z = 0, C, Z = -1, D, Z = -2, F.
The Z-scores and letter grades, along with the YBC data, for each backup replacing a starter were as follows:
Michael Deiter replacing Tyler Biadasz (1.22 YBC/Att)
Titans game + 2nd Dallas game
8 Rushing Attempts, -0.25 YBC/att
Z = -1.77, Grade F+
Trent Scott replacing Andrew Wylie (1.16 YBC/Att)
Steelers game
5 Rushing Attempts, 2.0 YBC/att
Z = 0.49, Grade C+
Cornelius Lucas replacing Andrew Wylie
Titans game
5 Rushing Attempts, 2.0 YBC/att
Z = 0.63, Grade B-
What these results tell us is that, in the two full games in which Michael Deiter replaced an injured Tyler Biadasz at center, there was a noticeable drop off in the YBC/att on runs through the A gaps. That drop off was large relative to the game to game variability of YBC/att when Biadasz was playing.
On the two occasions when Wylie was replaced for full games by a single player, there was a marginal improvement in YBC/Att on runs through the gaps on either side of the right tackle.
Whatever weaknesses there may be to the starting center and right tackle’s run blocking, these results suggest that the Commanders don’t have any obvious solutions sitting on the bench. Note that ESPN disagrees. They rank Cornelius Lucas as the 6th best run blocking OT based on RBWR, in a tie with Brandon Coleman.
Conclusions
Analysis of rushing stats broken down by OL gap revealed the following:
- In 2024, the Commanders ran their RB most frequently through the A gaps on either side of center and the B gap between left guard and left tackle.
- The RBs had the highest rushing average through the B gap between right guard and right tackle, and around the right end. The latter is due to inflation of the stats by a handful of breakaway runs by Brian Robinson in a few games.
- The peak rushing average through the right B gap corresponded with the peak of YBC, suggesting that it was a focus of strength for run blocking.
- Further breaking down the YBC figures to the level of individual OL starters seems to confirm that RG Sam Cosmi was the Commanders’ strongest run blocker, as reflected in RB rushing output through his gaps. That conclusion receives further support from independent sources (PFF, ESPN, SIS Run Stuff Rate), with the lone exception of SIS Missed Block Rate.
- The player level YBC data also point to LT Brandon Coleman as a quality run blocker. That conclusion is also supported by independent metrics (ESPN RBWR, SIS Missed Block & Stuff rates). The quality of run blocking and corresponding rushing success through his gaps appears have been obscured in the team level stats by relatively high proportion of blocking reps with other players at LT.
- The other starting OL ranked more or less equally by YBC through their gaps. Overall, the independent metrics tend to suggest that LG Nick Allegretti, C Tyler Biadasz and RG Andrew Wylie were mediocre in the run game.
Offseason Suggestions
The Commanders’ strongest run blocker, Sam Cosmi, tore his ACL in the Divisional playoff game against the Detroit Lions. He is likely to miss some time in 2025 and might not be fully back to pre-injury form until 2026. The Commanders will need to find a replacement to start the 2025 season.
Rookie Brandon Coleman stood out as a quality run blocker in his first season at LT. He made good progress in pass protection for a rookie OT drafted on Day 2, but struggled in some games against speed rushers. If he takes the next step this offseason, the Commanders will likely keep him at LT. But if there is any doubt, or a better option becomes available, they should consider moving him to LG where could upgrade the run blocking through the most utilized running gap.
The running game would benefit from an infusion of talent with premium run blocking skills at iOL as well as OT. In addition to replacing Cosmi for at least part of the season, the team could stand to improve in run blocking at LG, C and RT, and there are no obvious upgrades coming through the depth ranks.